 Global| May 05 2015
U.S. ADP: Job Growth Continues to Moderate
by:Tom Moeller
|in:Economy in Brief
Summary
The ADP/Moody's National Employment Report reported that nonfarm private sector payrolls increased 189,000 during March following a 214,000 improvement in February, revised from 212,000. The latest gain was the weakest since January [...]
The ADP/Moody's National Employment Report reported that nonfarm private sector payrolls increased 189,000 during March following a 214,000 improvement in February, revised from 212,000. The latest gain was the weakest since January of last year. It disappointed consensus expectations for a 225,000 rise in the Action Economics Forecast Survey.
The ADP survey is based on ADP's business payroll transaction system covering 411,000 companies and nearly 24 million employees. The data are processed by Moody's Analytics Inc., then calibrated and aligned with the BLS establishment survey data.
Medium sized payrolls rose a modest 62,000 increase (2.4% y/y), nearly the weakest gain in six months. Large firms posted a 19,000 rise (2.1% y/y), the easiest increase since a decline in October. Small sized payrolls improved 108,000 (2.7% y/y), a slight pickup from gains during the prior two months.
Employment in the goods producing sector nudged up 5,000 (2.4% y/y), the weakest gain since August of 2012. Jobs in the service sector increased a modest 184,000 (2.5% y/y), on a par with the prior two months. Professional & business employment gained 40,000 (3.3% y/y). Jobs in trade, transportation & utilities increased 25,000 (1.8% y/y) while employment in the financial sector improved 16,000 (1.8% y/y).
Construction sector employment grew 17,000 (5.1% y/y), the weakest rise since May. The number of manufacturing sector jobs declined 1,000 (+1.3% y/y), the first decline since January of last year.
The ADP National Employment Report data are maintained in Haver's USECON database; historical figures date back to April 2001. The figures in this report cover jobs only in the private sector. The expectation figure is available in Haver's AS1REPNA database.
| ADP/Moody's National Employment Report | Apr | Mar | Feb | Y/Y | 2014 | 2013 | 2012 |
|---|---|---|---|---|---|---|---|
| Nonfarm Private Payroll Employment (m/m chg, 000s) | 189 | 214 | 2.5% | 2.3% | 1.9% | 2.3% | |
| Small Payroll (1-49) | 108 | 103 | 2.7 | 2.1 | 1.9 | 2.5 | |
| Medium Payroll (50-499) | 62 | 57 | 2.4 | 2.8 | 2.2 | 2.1 | |
| Large Payroll (>500) | 19 | 53 | 2.1 | 1.8 | 1.6 | 2.1 | |
| Goods-Producing | 5 | 22 | 2.4 | 2.3 | 1.7 | 2.2 | |
| Construction | 17 | 28 | 4.9 | 4.6 | 3.5 | 2.5 | |
| Manufacturing | -1 | 2 | 1.3 | 1.2 | 0.9 | 1.6 | |
| Service-Producing | 184 | 192 | 2.5 | 2.3 | 2.0 | 2.3 |
U.S. Worker Productivity Decline is Deepened thus Raising Unit Labor Costs
by Tom Moeller May 6, 2015
Nonfarm productivity slipped at a 2.2% annual rate last quarter, revised from -1.8%. The decline followed a 3.9% 3Q rise. For all of last year, worker productivity rose 0.7% on average. Real output increased at a downwardly revised 2.6% rate last quarter (2.9% y/y) while hours worked gained 4.9% (3.0% y/y). Compensation per hour increased a 1.9% rate (2.5% y/y) but when adjusted for lower prices, it improved 3.1% (1.3% y/y). The decline in productivity caused unit labor costs to jump at an upwardly-revised 4.1% rate (2.6% y/y) after declines during the prior two quarters. The Q4 productivity decline compared to expectations for a 2.4% drop in the Action Economics Forecast Survey. A 3.3% rise in unit labor costs was expected.
Manufacturing sector worker productivity slipped at a 0.1% rate (+2.4% y/y), revised from +1.3%, after a 3.5% rise. For all of last year, productivity grew 2.2% after a 1.9% increase in 2013. Output grew 4.3% last quarter (4.5% y/y) after a 4.9% gain, while hours worked improved 4.4% (2.0% y/y) following a 1.4% Q3 increase. Worker compensation per hour increased at a 1.4% rate (2.4% y/y). Adjusted for price inflation, compensation gained 2.7% (1.2% y/y). Unit labor costs increased an upwardly-revised 1.5% (0.0% y/y) following two quarters of sharp decline.
The productivity & cost figures are available in Haver's USECON database. The expectations figure is from Action Economics and is the AS1REPNA database.
| Productivity & Costs (SAAR,%) | Q1'15 | Q4'14 | Q3'14 | Q1 Y/Y | 2014 | 2013 | 2012 |
|---|---|---|---|---|---|---|---|
| Nonfarm Business Sector | |||||||
| Output per Hour (Productivity) | -2.2 | 3.9 | -0.1 | 0.7 | 0.9 | 1.0 | |
| Compensation per Hour | 1.9 | 2.8 | 2.5 | 2.5 | 1.1 | 2.7 | |
| Unit Labor Costs | 4.1 | -1.0 | 2.6 | 1.8 | 0.3 | 1.7 | |
| Manufacturing Sector | |||||||
| Output per Hour (Productivity) | -0.1 | 3.5 | 2.4 | 2.2 | 1.9 | 1.0 | |
| Compensation per Hour | 1.4 | 2.1 | 2.4 | 2.3 | 0.5 | 1.8 | |
| Unit Labor Costs | 1.5 | -1.3 | 0.0 | 0.1 | -1.4 | 0.8 | |
U.S. Mortgage Loan Applications Move Higher as Rates Continue To Fall
by Tom Moeller May 6, 2015
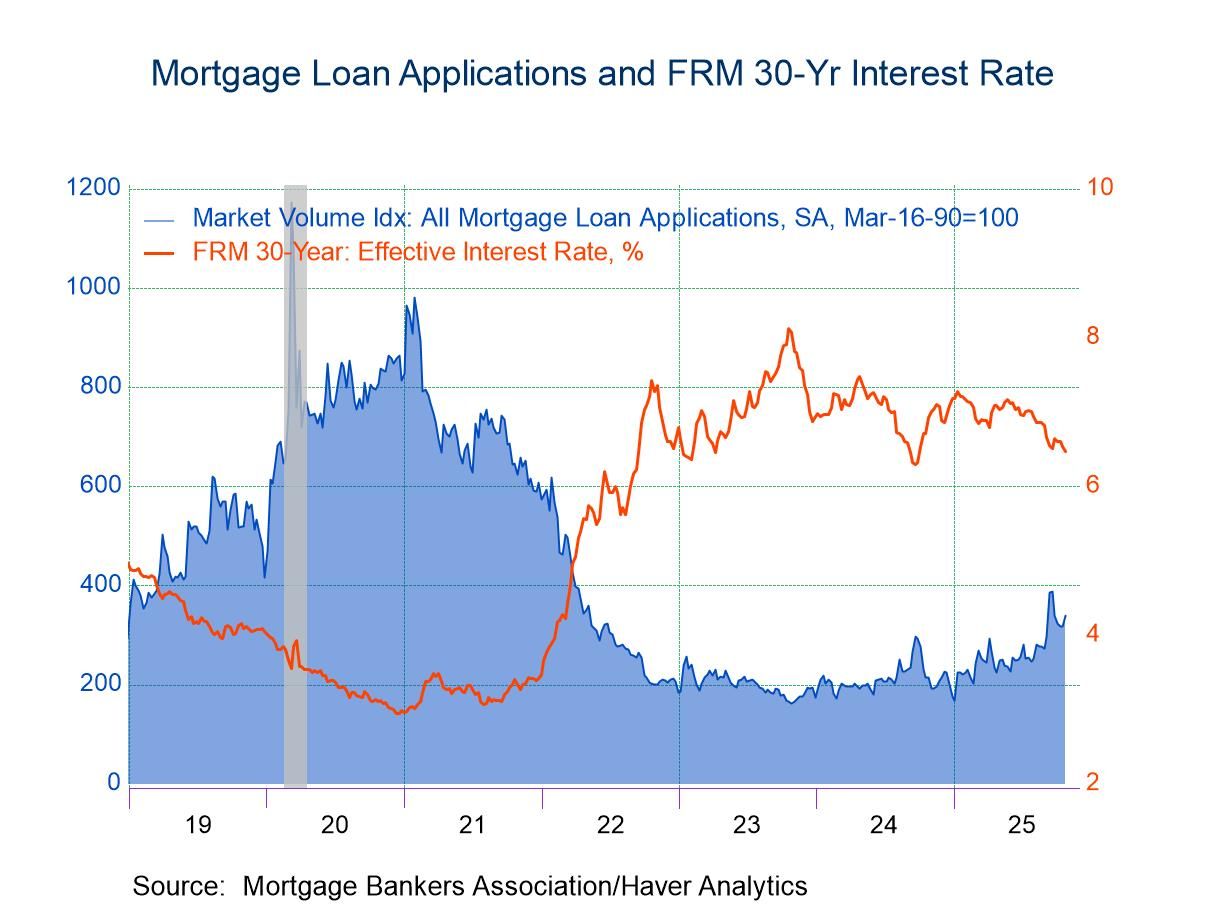
The Mortgage Bankers Association reported that its total Mortgage Market Volume Index increased 2.3% last week (28.6% y/y) and made up the prior week's decline. Purchase applications jumped 5.0% (15.6% y/y) to the highest level since June 2013. Refinance applications edged 0.9% higher (41.0% y/y).
The effective interest rate on a 15-year mortgage declined to 3.17%, reversing increases during February and March. The effective rate on a 30-year fixed rate loan also returned to a two-month low of 3.93%. The rate on a Jumbo 30-year loan fell to 3.89%. For adjustable 5-year mortgages, the effective interest rate ticked higher to 2.99%, but remained near its lowest level since June 2013.
The average mortgage loan size declined to $264,900 (+8.6% y/y). For refinancings it fell to $243,300 (16.3% y/y) but for purchases it rose to $292,700 (4.3% y/y).
Applications for fixed interest rate loans increased 33.7% y/y, but adjustable rate loan applications declined 16.1% y/y.
The survey covers over 75 percent of all U.S. retail residential mortgage applications, and has been conducted weekly since 1990. Respondents include mortgage bankers, commercial banks and thrifts. The base period and value for all indexes is March 16, 1990=100. The figures for weekly mortgage applications and interest rates are available in Haver's SURVEYW database.
| MBA Mortgage Applications (SA, 3/16/90=100) | 05/01/15 | 04/24/15 | 04/17/15 | Y/Y % | 2014 | 2013 | 2012 |
|---|---|---|---|---|---|---|---|
| Total Market Index | 447.9 | 458.4 | 28.6 | 361.5 | 616.6 | 813.8 | |
| Purchase | 205.4 | 205.4 | 15.6 | 172.1 | 197.5 | 187.8 | |
| Refinancing | 1,850.0 | 1,920.1 | 41.0 | 1,449.8 | 3,070.0 | 4,505.0 | |
| 15-Year Mortgage Effective Interest Rate (%) | 3.22 | 3.17 | 3.64 (4/14) |
3.54 | 3.42 | 3.25 |
Tom Moeller
AuthorMore in Author Profile »Prior to joining Haver Analytics in 2000, Mr. Moeller worked as the Economist at Chancellor Capital Management from 1985 to 1999. There, he developed comprehensive economic forecasts and interpreted economic data for equity and fixed income portfolio managers. Also at Chancellor, Mr. Moeller worked as an equity analyst and was responsible for researching and rating companies in the economically sensitive automobile and housing industries for investment in Chancellor’s equity portfolio. Prior to joining Chancellor, Mr. Moeller was an Economist at Citibank from 1979 to 1984. He also analyzed pricing behavior in the metals industry for the Council on Wage and Price Stability in Washington, D.C. In 1999, Mr. Moeller received the award for most accurate forecast from the Forecasters' Club of New York. From 1990 to 1992 he was President of the New York Association for Business Economists. Mr. Moeller earned an M.B.A. in Finance from Fordham University, where he graduated in 1987. He holds a Bachelor of Arts in Economics from George Washington University.


