 Global| Mar 26 2009
U.S. 4Q GDP Decline Remains Sharpest Since Early 1980s As Profits Crater
by:Tom Moeller
|in:Economy in Brief
Summary
The U.S. Bureau of Economic Analysis indicated that its revised estimate of 4Q '08 was little changed. The 6.3% (AR) decline compared to the preliminary estimate of a 6.2% drop. Nevertheless, the decline was the steepest since 1982 [...]
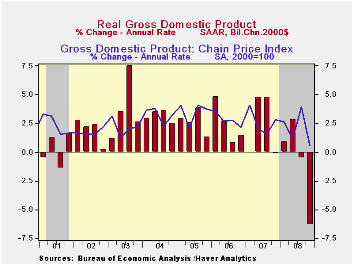
The U.S. Bureau of Economic Analysis indicated that its revised estimate of 4Q '08 was little changed. The 6.3% (AR) decline compared to the preliminary estimate of a 6.2% drop. Nevertheless, the decline was the steepest since 1982 and it approached the 7.8% quarterly decline during the "credit crunch" recession of 1980. Consensus expectations had been for a deepening of the 4Q decline to 6.6%.
Accompanying the GDP report was the first look at 4Q corporate profits. They fell 16.5% (-21.5% y/y) and the decline was just short of the record 17.0% drop logged during the recession of 1953. A record 59.3% drop (-66.9% y/y) in financial sector earnings led the downturn as the real estate industry imploded. Economic recession further reduced nonfinancial sector earnings by 10.7% (-8.9% y/y) before costs were brought fully under control. That decline came despite the halving of crude oil prices and was the worst quarterly drop since early 1981. Foreign sector earnings held together and rose 4.6% during 4Q but they were off 6.0% versus the year prior.
Revisions to the GDP components were fairly minor. Offsetting
one another were downward revisions to inventories' negative
contribution to GDP growth and an upward revision to foreign trade.
Nevertheless, the negative contribution from trade to U.S. growth was
the first since 1Q '07. Exports fell at a 23.6% rate (-1.8% y/y) as
recessions abroad intensified. U.S. imports fell at a 17.5% rate (-7.5%
y/y) with the developing U.S. recession.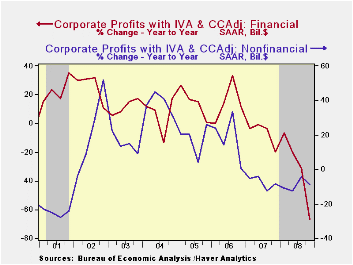
Real U.S. final sales to domestic purchasers contracted at a 5.8% annual rate and that was the worst decline since the 1980 recession when consumers pocketed their credit cards. Personal consumption expenditures fell an unrevised 4.3% (-1.5% y/y) as spending on motor vehicles declined at a huge 38.0% annual rate. Business fixed investment fell at a 21.7% rate (-5.2% y/y) and residential investment dropped at a 22.8% rate (-19.4% y/y).
The government sector contributed marginally to GDP growth last quarter. Activity rose at a 1.3% annual rate (3.2% y/y) led by a 6.9% (8.2% y/y) rise in Federal spending.
The estimate of price inflation was unrevised. The 0.5% increase in the GDP chain price index remained greatly reduced from the 3.9% advance during 3Q. The PCE price index fell at a 4.9% annual rate as gasoline prices fell. The residential investment chain price index fell at a 9.4% annual rate while the business fixed investment price index rose 4.6%.
The U.S. National Income & Product Account data is available in Haver's USECON and the USNA databases.
Sources of the Great Moderation: shocks, friction, or monetary policy? from the Federal Reserve Bank of San Francisco is available here.
| Chained 2000$, % AR | 4Q '08 (Final) | 4Q '08 (Preliminary) | 4Q '08 (Advance) | 3Q '08 | 4Q Y/Y | 2008 | 2007 | 2006 |
|---|---|---|---|---|---|---|---|---|
| GDP | -6.3 | -6.2 | -3.8 | -0.5 | -0.8 | 1.1 | 2.0 | 2.8 |
| Inventory Effect | -0.1 | 0.2 | 1.3 | 0.8 | 0.1 | 0.1 | -0.4 | 0.0 |
| Final Sales | -6.2 | -6.4 | -5.1 | -1.3 | -0.7 | 1.4 | 2.4 | 2.8 |
| Foreign Trade Effect | -0.2 | -0.5 | 0.1 | 1.1 | 1.4 | 1.4 | 0.6 | 0.2 |
| Domestic Final Demand | -5.8 | -5.7 | -4.9 | -2.2 | -1.7 | -0.0 | 1.8 | 2.6 |
| Chained GDP Price Index | 0.5 | 0.5 | -0.1 | 3.9 | 2.0 | 2.2 | 2.7 | 3.2 |
by Tom Moeller March 26, 2009

Labor market stress continues. Continuing claims for unemployment insurance rose to yet another record high of 5,560,000 and remained nearly double that of last March. The series dates back to 1966. The four-week average of continuing claims also rose to another record of 5,331,250. Continuing claims provide some indication of workers' ability to find employment and they lag the initial claims figures by one week.
At the margin, there appears to be no let-up in the bleak employment picture. Initial claims for unemployment insurance rose to 652,000 which was near the series' recent high. At 652,000 the figure was close to its highest since 1982 and it roughly equaled expectations.
The Labor Department indicated that the largest increases in initial claims for the week ending March 14 were in Tennessee (+1,394), Texas (+1,028), Rhode Island (+904), North Dakota (+857), and Connecticut (+522), while the largest decreases were in California (-8,555), Michigan (-7,523), Indiana (-7,475), Pennsylvania (-3,757), and Ohio (-3,397).
Though the latest level of continuing claims was a record, the
labor force has grown as well, by nearly 30% over the last twenty
years. Therefore, the insured rate of unemployment is not at a record
high. It rose to 4.2% which was the highest since June of 1983. During
the last ten years there has been a 93% correlation between the level
of the insured unemployment rate and the overall rate of unemployment
published by the Bureau of Labor Statistics.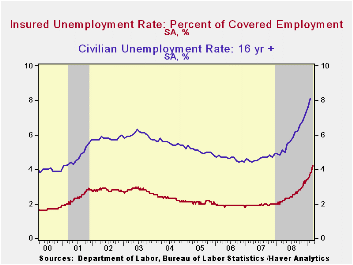
The highest insured unemployment rates in the week ending March 7 were in Michigan (7.8 percent), Oregon (7.6), Idaho (7.2), Wisconsin (6.8), Pennsylvania (6.5), Rhode Island (6.5), Nevada (6.2), Montana (6.0), Indiana (5.9), and Vermont (5.9).
The unemployment insurance claim data is available in Haver's WEEKLY database.
| Unemployment Insurance (000s) | 03/21/09 | 03/14/09 | 03/07/09 | Y/Y | 2008 | 2007 | 2006 |
|---|---|---|---|---|---|---|---|
| Initial Claims | 652 | 644 | 657 | 77.7% | 420 | 321 | 313 |
| Continuing Claims | -- | 5,560 | 5,438 | 96.1% | 3,342 | 2,552 | 2,459 |
by Robert Brusca March 26, 2009

If there is an enigmatic economy right now it is the UK’s. The
central bank is very worried about deflation and economic weakness. Yet
the last retail prices report showed inflation up sharply and the core
rate stubborn. While surveys of consumer activity and measures of
confidence are weak, Yr/Yr real retail sales excluding autos are up a
very solid and strong 5.6% and two months into the quarter they are up
at a 5.9% pace.
Still, in February, retail sales fell by 1% in nominal terms
and 1.9% in real terms (ex autos).
Retail sales have fallen in seven of the last 12 months. They
are down in four of the last six months and have risen in only one of
the last six months- hardly a picture of strength. The 1.5% rise in
nominal sales in January is an important factor keeping the current
growth rates firm. Just to complicated things, ex auto real retail
sales are up in Three of the past six months as well as in three of the
past four months.
This strength in ex-auto sales is surprising. The UK economy
is suffering though severe financial problems as is the US. Sentiment
is down strongly. But the inflation figures do not want to settle down
and consumer spending simply finds ways to stay alive despite some
sputtering. It is hard to get a grip on the UK economy because of these
divergences. The inability of the government to sell as many bonds as
it tried to auction yesterday is another sign of unmoored expectations.
Inventors are having a hard time getting a grip on the economy and that
makes it hard for them to make investment decisions. I still think
weakness will enfold this economy and that the moves to stimulate are
the right ones, but for the moment, some unexpected readings of
strength are helping to support UK growth and to confuse investors.
| UK Real and Nominal Retail Sales | Quarter | |||||||
|---|---|---|---|---|---|---|---|---|
| Nominal | Feb-09 | Jan-09 | Dec-08 | 3-MO | 6-MO | 12-MO | Yr Ago | 2-date |
| Retail Total | -1.0% | 1.5% | 0.0% | 2.1% | -0.7% | 0.5% | 4.8% | 4.7% |
| Food Bev & Tobacco | 0.7% | 0.6% | -0.7% | 2.2% | 5.3% | 5.1% | 5.7% | 2.9% |
| Clothing footwear | -3.0% | 5.0% | 1.0% | 11.8% | -4.8% | -1.1% | 3.1% | 19.7% |
| Real | ||||||||
| Retail Ex auto | -1.9% | 0.8% | 1.9% | 3.2% | 0.9% | 0.5% | 5.6% | 5.9% |

Tom Moeller
AuthorMore in Author Profile »Prior to joining Haver Analytics in 2000, Mr. Moeller worked as the Economist at Chancellor Capital Management from 1985 to 1999. There, he developed comprehensive economic forecasts and interpreted economic data for equity and fixed income portfolio managers. Also at Chancellor, Mr. Moeller worked as an equity analyst and was responsible for researching and rating companies in the economically sensitive automobile and housing industries for investment in Chancellor’s equity portfolio. Prior to joining Chancellor, Mr. Moeller was an Economist at Citibank from 1979 to 1984. He also analyzed pricing behavior in the metals industry for the Council on Wage and Price Stability in Washington, D.C. In 1999, Mr. Moeller received the award for most accurate forecast from the Forecasters' Club of New York. From 1990 to 1992 he was President of the New York Association for Business Economists. Mr. Moeller earned an M.B.A. in Finance from Fordham University, where he graduated in 1987. He holds a Bachelor of Arts in Economics from George Washington University.
More Economy in Brief


