 Global| Aug 08 2008
U.S. 2Q Productivity Growth Weakened, Costs Still Under Control
by:Tom Moeller
|in:Economy in Brief
Summary
Labor productivity in the nonfarm business sector rose 2.2% at an annual rate last quarter. The increase fell short of Consensus expectations for a 2.5% rise while growth during 1Q and for all of last year was revised down. Output [...]
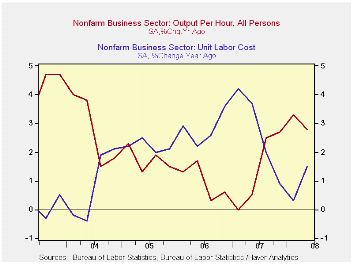
Labor productivity in the nonfarm business sector rose 2.2% at an annual rate last quarter. The increase fell short of Consensus expectations for a 2.5% rise while growth during 1Q and for all of last year was revised down.
Output growth last quarter did nearly double from 1Q to a still-modest 1.7% but the y/y rate of increase fell by roughly one percentage point to 1.8%. That was accompanied by a drop in total hours worked at a 0.5% annual rate (-1.0% y/y) which was one-third the 1Q rate of decline.
Growth in compensation per hour did slow to 3.6% from gains
during the prior two quarters that were revised up. However, the y/y
gain picked up moderately to 4.3% and that exceeded the accelerated
rate of increase for all of last year.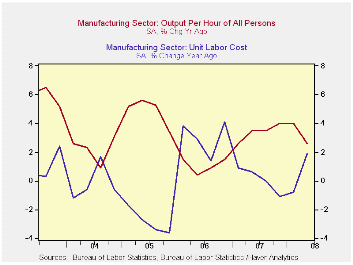
Unit labor cost growth fell to 1.3% after the 2.5% gain during 1Q. Year-to-year growth in costs did pick up modestly, however, to 1.5% but that remained down compared to recent years.
In the factory sector, productivity fell at a 1.4% rate during 2Q (2.6% y/y) and the decline lowered year-to-year gain to its weakest since 1Q of last year. The deceleration occurred as y/y output growth slowed to roughly zero. As a result, unit labor costs rose at a 6.1% rate (1.9% y/y) and that q/q increase was the fastest since late 2006.
Multinationals Make the Most of IT from the Federal Reserve Bank of St. Louis is available here.
Creative Destruction, Documented from the
Federal Reserve Bank of Richmond can be found here.
| Nonfarm Business Sector (SAAR, %) | 2Q '08 | 1Q '08 | 4Q '07 | Y/Y | 2007 | 2006 | 2005 |
|---|---|---|---|---|---|---|---|
| Output per Hour | 2.2 | 2.6 | 0.8 | 2.8 | 1.4 | 1.0 | 1.7 |
| Compensation per Hour | 3.6 | 5.2 | 5.4 | 4.3 | 4.1 | 3.8 | 4.0 |
| Unit Labor Costs | 1.3 | 2.5 | 4.5 | 1.5 | 2.7 | 2.8 | 2.2 |
by Robert Brusca August 8, 2008
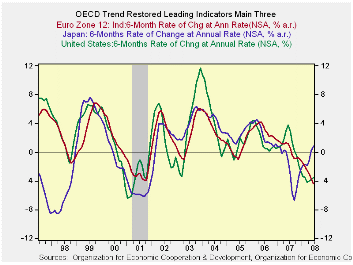
The OECD Trend-restored LEIs tell a story that is now becoming
familiar in the markets. The US is still weakening. But Europe is
weakening faster. Just today Italy reported a DECLINE in GDP for
2008Q2. Nout Wellink, an ECB board member, said the European growth
would… “not look so good.” Europe has been slow to admit how much its
economy is being impacted by oil and the financial crisis and the
strong euro. Denial has its costs.
I think we have finally heard the last from those poor souls
who argued that there was some sort of de-linkage going on in the
global economy. Europe would still grow, China, India ..etc. But
clearly the slowdown is hitting everyone. The Euro slowdown could
become more severe and that is part of the OECD warning this morning as
it sees a sharper slowing in the cards. OECD finds China and Brazil as
relative bright spots. The OECD said that while its leading indicators
point to slowdowns in the U.S., Japan, Germany, the U.K. and Canada,
they point to "strong" slowdowns in France and Italy. For Russia and
India, the leading indicators point to a downturn. Of course the
definition of downturn is not universal. To a fast growing economy it
could be just a big slowing in the growth rate. For most highly
developed economies it means there will be some decline in GDP.
For now the OECD message is clear and that message is not
welcome. Yet, neither is it a surprise to those who have paid
attention. Europeans have for some time looked at the bright side of
the picture and ignored the encroaching darkness. The ECB was bound and
determined to hike rates due to its horrific inflation overshoot of its
target. The ECB needed to see the strong the side of the economy to
justify a rate hike.
For now it seems to me the central banks have been put in a
very difficult position with a financial crises that crimped their
ability to act boldly. At the same time huge and ongoing increases in
oil prices struck. Exchange rates moved significantly as well. Looking
back, policy seems to have been well calibrated despite headline
inflation overshoot. The question may come to be asked if a core
inflation target might not work better in the future (since if we
assume the central banks more or less were really looking at core,
their actions are easier to understand). The ECB so badly has missed
its target it must have to wonder if wants to ever go though that
again. However, relative to a core inflation target it is has not done
so badly- nor has the Fed. We will have to see what lessons emerge from
this still evolving period.
While policy may have done a good job it nonetheless has not
been able to avoid the scars and scrapes on banks and on the real
sector. Policy has done a good job but has worked no miracles. There is
room for improvement. But first there is a policy to implement in a
still nettlesome business cycle that is building downside strength.
| OECD Trend-restored leading Indicators | ||||
|---|---|---|---|---|
| Growth progression-SAAR | ||||
| 3-Mos | 6-Mos | 12-Mos | Yr-Ago | |
| OECD | -3.5% | -3.0% | -3.1% | 2.1% |
| OECD7 | -2.3% | -3.1% | -3.8% | 1.5% |
| OECD Europe | -6.3% | -5.2% | -3.7% | 1.1% |
| OECD Japan | 3.2% | 0.7% | -1.6% | -0.3% |
| OECD US | -1.2% | -3.0% | -4.1% | 2.7% |
| Six month readings at 6-Mo Intervals: | ||||
| Recent six | 6-Mos Ago | 12-Mos Ago | 18-Mos Ago | |
| OECD | -3.0% | -3.1% | 2.7% | 1.6% |
| OECD7 | -3.1% | -4.5% | 2.2% | 0.9% |
| OECD Europe | -5.2% | -2.2% | 1.0% | 1.2% |
| OECD Japan | 0.7% | -3.9% | -1.9% | 1.2% |
| OECD US | -3.0% | -5.3% | 4.1% | 1.3% |
| Slowdowns indicated by BOLD RED | ||||
by Robert Brusca August 8, 2008
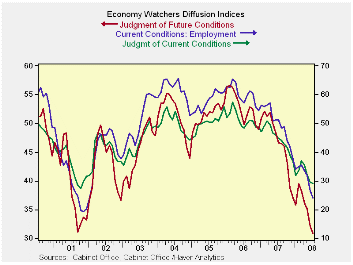
Too much watching, not enough spending?
Japan’s economy watchers index has dropped sharply. Its
components are all on 5-Year lows and have been that way for two months
running. The NTC MFG index is on a five year low. The Teikoku industry
readings are on five year lows. Japan’s own LEI has been weak but in
the OECD treatment the trend restored indices have Japan’s index on a
rising trend, but steady month-to-month. The readings in these
Japan-based reports are much weaker than the OECD’s. And Japan is
looking very weak.
| Key Japanese surveys | |||||||
|---|---|---|---|---|---|---|---|
| Raw readings of each survey | Percent of 5Yr range* | ||||||
| Jul-08 | Jun-08 | May-08 | Apr-08 | Jul-08 | Jun-08 | May-08 | |
| Diffusion | |||||||
| Economy Watchers | 29.3 | 29.5 | 32.1 | 35.5 | 7.0% | 0.0% | 1.2% |
| Employment | 24.1 | 26.4 | 31.9 | 33.6 | 0.0% | 0.0% | 0.0% |
| Future | 30.8 | 32.1 | 35.1 | 36.1 | 0.0% | 0.0% | 0.0% |
| NTC MFG | 47.1 | 46.5 | 47.7 | 48.6 | 5.3% | 0.0% | 0.0% |
| Econ Trends (Teikoku'/50 neutral/weighted diffusion) | |||||||
| MFG | 32.9 | 34.4 | 35.6 | 36.9 | 0.0% | 0.0% | 0.0% |
| Retail | 28.3 | 28.7 | 31.5 | 32.1 | 0.0% | 0.0% | 1.4% |
| Wholesale | 31.0 | 32.4 | 33.9 | 34.5 | 0.0% | 0.0% | 0.0% |
| Services | 36.2 | 37.5 | 39.7 | 40.4 | 0.0% | 0.0% | 0.0% |
| Construction | 25.5 | 26.9 | 27.1 | 28.0 | 0.0% | 0.0% | 0.0% |
| 100 is high; Zero is low | |||||||

Tom Moeller
AuthorMore in Author Profile »Prior to joining Haver Analytics in 2000, Mr. Moeller worked as the Economist at Chancellor Capital Management from 1985 to 1999. There, he developed comprehensive economic forecasts and interpreted economic data for equity and fixed income portfolio managers. Also at Chancellor, Mr. Moeller worked as an equity analyst and was responsible for researching and rating companies in the economically sensitive automobile and housing industries for investment in Chancellor’s equity portfolio. Prior to joining Chancellor, Mr. Moeller was an Economist at Citibank from 1979 to 1984. He also analyzed pricing behavior in the metals industry for the Council on Wage and Price Stability in Washington, D.C. In 1999, Mr. Moeller received the award for most accurate forecast from the Forecasters' Club of New York. From 1990 to 1992 he was President of the New York Association for Business Economists. Mr. Moeller earned an M.B.A. in Finance from Fordham University, where he graduated in 1987. He holds a Bachelor of Arts in Economics from George Washington University.
More Economy in Brief


