 Global| Jun 17 2009
U.S. 1Q'09 Current Account Deficit Shrinks To Smallest Since 2001
by:Tom Moeller
|in:Economy in Brief
Summary
The U.S. current account deficit shrank to its lowest level since 2001 as the recession and lower oil prices limited imports. Despite recessions abroad which lowered U.S. exports, imports fell even more rapidly. The deficit of $101.5 [...]
The U.S. current account deficit shrank to its lowest level since 2001 as the recession and lower oil prices limited imports. Despite recessions abroad which lowered U.S. exports, imports fell even more rapidly. The deficit of $101.5 billion was deeper than the Consensus expectation for a reading of $85.0 billion.
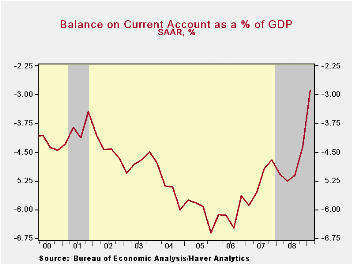
As a percentage of GDP, the shrinkage of the U.S. deficit was dramatic. The 2.9% 1Q figure was the smallest since early-1999. This percentage is sharply reduced from the 6.6% peak reached late in 2005.
Recession in the U.S. worked with the decline in oil prices to drop the 1Q deficit on traded goods to $124.0 billion, its lowest since 2004. Though growth in goods exports was a negative 21.0% y/y, imports fell by a greater 30.1% spurred by the drop in oil prices.
Fewer U.S. citizens went abroad this year and more came here. As a result, the balance on services trade narrowed as exports fell more then imports. The 1Q surplus of $32.8 billion compared to a peak surplus of $40.0 billion late during 2007. That decline came as exports fell 7.2% y/y against a 6.4% decline in imports.
From the capital account side of the ledger, the U.S. balance on private direct investment remained stable and slightly positive q/q. That compares with deficits during the last three years. U.S. investment abroad rose while foreign investment here fell sharply.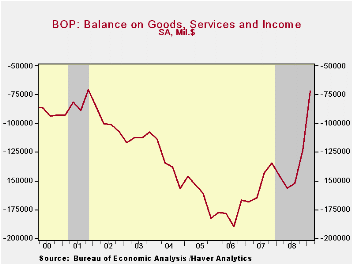
Ties that bind: bilateral trade's role in synchronizing business cycles from the Federal Reserve Bank of Dallas can be found here.
| US Balance of Payments SA | 1Q '09 | 4Q '08 | Year Ago | 2008 | 2007 | 2006 |
|---|---|---|---|---|---|---|
| Current Account Balance ($ Bil.) | -101.5 | -154.9 | -179.3 | -706.1 | -726.6 | -803.5 |
| Deficit % of GDP | 2.9 | 4.4 | 5.1 | 5.0 | 5.3 | 6.1 |
| Balance on Goods ($ Bil.) | -124.0 | -178.8 | -218.8 | -840.3 | -831.0 | -847.3 |
| Exports | -14.2% | -14.0% | -21.0% | 12.2% | 12.1% | 13.8% |
| Imports | -20.4% | -16.0% | -30.1% | 7.5% | 5.7% | 10.7% |
| Balance on Private Services ($ Bil.) | 32.8 | 34.3 | 36.2 | 144.3 | 129.6 | 86.9 |
| Exports | -5.7 | -4.7% | -7.2% | 8.9% | 15.8% | 12.0% |
| Imports | -6.2 | -5.4% | -6.4% | 8.0% | 7.5% | 11.3% |
| Balance on Income ($ Bil.) | 19.3 | 21.1 | 36.7 | 118.2 | 90.8 | 48.1 |
| Unilateral Transfers ($ Bil.) | -29.6 | -31.5 | -33.3 | -128.4 | -116.0 | -91.3 |

Tom Moeller
AuthorMore in Author Profile »Prior to joining Haver Analytics in 2000, Mr. Moeller worked as the Economist at Chancellor Capital Management from 1985 to 1999. There, he developed comprehensive economic forecasts and interpreted economic data for equity and fixed income portfolio managers. Also at Chancellor, Mr. Moeller worked as an equity analyst and was responsible for researching and rating companies in the economically sensitive automobile and housing industries for investment in Chancellor’s equity portfolio. Prior to joining Chancellor, Mr. Moeller was an Economist at Citibank from 1979 to 1984. He also analyzed pricing behavior in the metals industry for the Council on Wage and Price Stability in Washington, D.C. In 1999, Mr. Moeller received the award for most accurate forecast from the Forecasters' Club of New York. From 1990 to 1992 he was President of the New York Association for Business Economists. Mr. Moeller earned an M.B.A. in Finance from Fordham University, where he graduated in 1987. He holds a Bachelor of Arts in Economics from George Washington University.
More Economy in Brief


