 Global| Apr 30 2008
U.S. 1Q'08 GDP Stable at 0.6%, Two Quarter Growth At Recession Level
by:Tom Moeller
|in:Economy in Brief
Summary
U.S. real GDP growth during 1Q'08 remained stable with the prior quarter at 0.6%, about as expected. Together, growth during the last two quarters was the weakest since the end of the last recession in 2001. Negative 0.4% 1Q growth in [...]
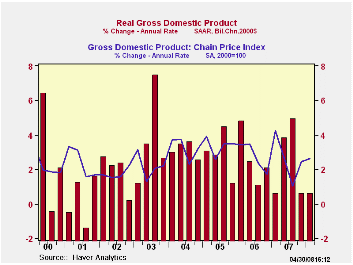
U.S. real GDP growth during 1Q'08 remained stable with the prior quarter at 0.6%, about as expected. Together, growth during the last two quarters was the weakest since the end of the last recession in 2001.
Negative 0.4% 1Q growth in final sales to domestic purchasers was the first sub-zero reading since the earlier recession in 1991.
Residential construction led that slip with a 26.6% (-21.2% y/y) drop which was the fastest rate of decline since the recession in 1981. For the quarter it alone reduced overall real GDP growth by 1.2 percentage points. Business fixed investment also was weak and posted a 2.5% (+5.8% y/y) decline which was its first negative print since 4Q'06 and the largest negative reading since early 2004. Overall it reduced 1Q GDP growth by 0.3 percentage points. The decline was paced by a 6.2% (+11.5% y/y) decline in investment in structures while equipment spending fell at a 0.7% rate (+3.3% y/y). That decline represented a shortfall in investment in transportation equipment while growth in information processing equipment and also industrial equipment remained positive.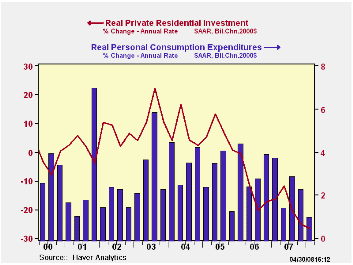 Growth in real personal consumption also weakened to just 1.0% (1.9% y/y) which was its weakest since the recession year 2001. Fewer purchases of autos & light trucks reduced spending here at an 11.4% (-4.3% y/y) while spending on furniture & other household equipment also fell. In the nondurable area, spending on food as well as gasoline both dropped. Spending on services actually accelerated slightly due to faster growth in spending on household operation. Growth in real PCE added 0.7 percentage point to 1Q real GDP growth.
Earlier sizable additions to GDP growth from an improved foreign trade deficit eased to just a 0.2 percentage point contribution in 1Q. The lessened addition was due to weaker growth in exports of 5.5% after an 8.1% rise last year and an 8.4% gain in 2006. Imports grew at a 2.5% rate after a 1.9% rise last year and a 5.9% 2006 rise.
Growth in real personal consumption also weakened to just 1.0% (1.9% y/y) which was its weakest since the recession year 2001. Fewer purchases of autos & light trucks reduced spending here at an 11.4% (-4.3% y/y) while spending on furniture & other household equipment also fell. In the nondurable area, spending on food as well as gasoline both dropped. Spending on services actually accelerated slightly due to faster growth in spending on household operation. Growth in real PCE added 0.7 percentage point to 1Q real GDP growth.
Earlier sizable additions to GDP growth from an improved foreign trade deficit eased to just a 0.2 percentage point contribution in 1Q. The lessened addition was due to weaker growth in exports of 5.5% after an 8.1% rise last year and an 8.4% gain in 2006. Imports grew at a 2.5% rate after a 1.9% rise last year and a 5.9% 2006 rise.
Faster inventory accumulation added 0.8 percentage points to 1Q GDP growth but that only made up some of the 1.8 point subtraction in 4Q.
The GDP chain price index grew at a 2.6% annual rate which was its fastest gain in three quarters. The PCE price index rose at a 3.5% rate (3.4% y/y) which was down slightly from the 3.9% rise in 4Q. Less food & energy consumer prices rose at a 2.2% rate which was stable with growth during the prior four years. The price index for business fixed investment fell a slight 0.1% which was the third decline in the last four quarters but prices for residential investment fell at a 2.3% rate which was the fastest rate of decline since 1970 (no typo). Quicker growth in the overall GDP price index was due to exports (9.0% y/y) and government consumption (6.9% y/y).
| Chained 2000$, % AR | 1Q '08 | 4Q '07 | 3Q '07 | Y/Y | 2007 | 2006 | 2005 |
|---|---|---|---|---|---|---|---|
| GDP | 0.6 | 0.6 | 4.9 | 2.5 | 2.2 | 2.9 | 3.1 |
| Inventory Effect | 0.8 | -1.8 | 0.9 | 0.1 | -0.3 | 0.1 | -0.2 |
| Final Sales | -0.2 | 2.4 | 4.0 | 2.4 | 2.5 | 2.8 | 3.3 |
| Foreign Trade Effect | 0.2 | 1.0 | 1.4 | 1.0 | 0.7 | -0.1 | -0.2 |
| Domestic Final Demand | -0.4 | 1.3 | 2.5 | 1.4 | 1.8 | 2.7 | 3.3 |
| Chained GDP Price Index | 2.6 | 2.4 | 1.0 | 2.2 | 2.7 | 3.2 | 3.2 |

Tom Moeller
AuthorMore in Author Profile »Prior to joining Haver Analytics in 2000, Mr. Moeller worked as the Economist at Chancellor Capital Management from 1985 to 1999. There, he developed comprehensive economic forecasts and interpreted economic data for equity and fixed income portfolio managers. Also at Chancellor, Mr. Moeller worked as an equity analyst and was responsible for researching and rating companies in the economically sensitive automobile and housing industries for investment in Chancellor’s equity portfolio. Prior to joining Chancellor, Mr. Moeller was an Economist at Citibank from 1979 to 1984. He also analyzed pricing behavior in the metals industry for the Council on Wage and Price Stability in Washington, D.C. In 1999, Mr. Moeller received the award for most accurate forecast from the Forecasters' Club of New York. From 1990 to 1992 he was President of the New York Association for Business Economists. Mr. Moeller earned an M.B.A. in Finance from Fordham University, where he graduated in 1987. He holds a Bachelor of Arts in Economics from George Washington University.
More Economy in Brief


