 Global| Jun 26 2008
U.S. 1Q'08 GDP Revised Up Minimally, Profits Revised Down
by:Tom Moeller
|in:Economy in Brief
Summary
U.S. real GDP growth during 1Q'08 was revised minimally higher and showed 1.0% growth after the 0.6% rise during 4Q '07. Still, together, the figures are the weakest since near the end of the recession year of 2001. Corporate profits [...]

U.S. real GDP growth during 1Q'08 was revised minimally higher and showed 1.0% growth after the 0.6% rise during 4Q '07. Still, together, the figures are the weakest since near the end of the recession year of 2001.
Corporate profits were revised down considerably to a 1.3% annual rate of decline (+1.0% y/y) after the initial estimate of a 1.3% (1.7% y/y) rise. That followed the decline at a 12.4% rate in 4Q and at a 4.9% rate in 3Q. Lower earnings in foreign sector earnings, which now are estimated to have declined at a 21.1% rate (+25.5% y/y), contrasted with the initial estimate of 5.1% growth.Earnings in the financial sector were revised up to a 14.4% (-8.5% y/y) rate of increase following sharp declines during the prior two quarters. U.S. nonfinancial sector earnings were minimally revised to a 1.8% (-2.6% y/y) rate of increase after two quarters of sharp decline.
In the GDP accounts, revisions to trade and inventories were minimal. An improved foreign trade deficit added an unrevised 0.8 percentage points to GDP growth as growth in exports was raised to 5.5% (9.5% y/y) but so too were imports which now are estimated to have declined at only a 0.7% rate (-0.1% y/y).
Inventory accumulation is now estimated to
have added nothing to 1Q GDP growth, down from the last reading of a
0.2 point addition. That contrasted with a 1.8 point subtraction from
growth during 4Q '07.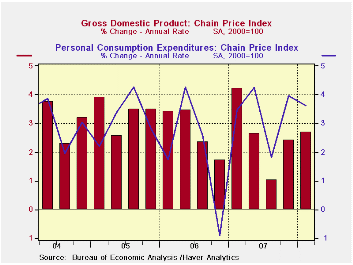
Growth in final sales to domestic purchasers was revised up to a minimal 0.1% increase after a 1.3% rise during 4Q. These figures are weakest readings since the earlier recession in 1991.
The decline in residential construction was still quite severe. Activity declined at a little revised 24.5% (-20.7% y/y) rate which was about equal to the drops in 4Q and 3Q. These are the quickest rates of decline since the recession in 1981 and the 1Q drop reduced overall real GDP growth by 1.2 percentage points.
Business fixed investment was revised up slightly to a 0.5% (+6.7% Y/Y) rate of increase. It still was the smallest rate of increase since early 2004. Investment in structures grew at a little revised 1.3% (13.7% y/y) rate while equipment investment rose at a 0.2% (+3.5% y/y) rate rather than declining slightly.
Growth in real personal consumption was little revised at a 1.1% (1.9% y/y) gain which was its weakest since the recession year of 2001. Spending on autos & light trucks fell at a 13.4% (-4.8% y/y) rate while spending on furniture & other household equipment rose at a still weak 1.0% (5.1% y/y) rate. Growth in real PCE added 0.8 percentage points to 1Q real GDP growth.
The GDP chain price index was revised up slightly to a 2.7% annual rate of growth which was its fastest gain in three quarters. The PCE price index rose at a 3.6% rate (3.4% y/y) which was down slightly from the 3.9% rise in 4Q. Less food & energy consumer prices rose at a 2.3% rate which was revised up slightly.
| Chained 2000$, % AR | 1Q '08 (Final) | 1Q '08 (Preliminary) | 1Q '08 (Advance) | 4Q '07 | 3Q '07 | 1Q Y/Y | 2007 | 2006 | 2005 |
|---|---|---|---|---|---|---|---|---|---|
| GDP | 1.0 | 0.9 | 0.6 | 0.6 | 4.9 | 2.5 | 2.2 | 2.9 | 3.1 |
| Inventory Effect | 0.0 | 0.2 | 0.8 | -1.8 | 0.9 | 0.1 | -0.3 | 0.1 | -0.2 |
| Final Sales | 0.9 | 0.7 | -0.2 | 2.4 | 4.0 | 2.7 | 2.5 | 2.8 | 3.3 |
| Foreign Trade Effect | 0.8 | 0.8 | 0.2 | 1.0 | 1.4 | 1.0 | 0.7 | -0.1 | -0.2 |
| Domestic Final Demand | 0.1 | -0.1 | -0.4 | 1.3 | 2.5 | 1.4 | 1.8 | 2.7 | 3.3 |
| Chained GDP Price Index | 2.7 | 2.6 | 2.6 | 2.4 | 1.0 | 2.2 | 2.7 | 3.2 | 3.2 |
by Tom Moeller June 26, 2008
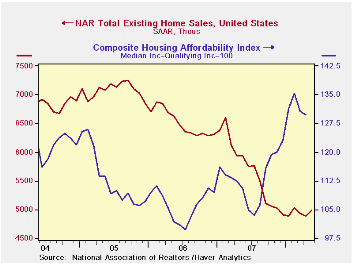
The National Association of Realtors reported that, in May, sales of existing homes rose 2.0% to 4.99M after two months of slight decline. The figure was about as expected. Total sales include sales of condos and co-ops.
The latest level of sales is near the low reached last
November after having declined by one-third from the 2005 peak. 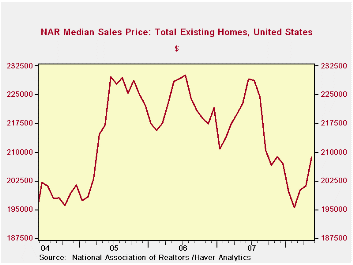
Sales of existing single family homes rose 1.6% and, together with the overall series, were about level with this past Winter. Nevertheless, the series for single family homes (which has a longer history than the total) indicated that sales were at the lowest level since early-1998.
By region, home sales in the West rose 2.0% for the third month of meaningful increase. Elsewhere sales in the Northeast and in the Midwest offset sharp April declines while sales down South fell to a new low.
Median home prices rose 3.7% last month. Prices were up 6.6% from their February low after versus a 33% rate of decline last Fall. Indeed, prices may have firmed with sales after the one-third rate of decline this past Winter. However, prices typically firm come Spring.
The number of unsold homes on the market fell 1.4% (+2.4% y/y). At the current sales rate the inventory still amounts to 10.8 months supply which is near the record series high. For single family homes there was a 10.4 months supply at the current sales rate.
| Existing
Single Family Home Sales (Thous) |
May | y/y % | April | May '07 | 2007 | 2006 | 2005 |
|---|---|---|---|---|---|---|---|
| Total | 4,990 | -15.9 | 4,890 | 5,930 | 5,672 | 6,508 | 7,076 |
| Northeast | 910 | -15.0 | 870 | 1,070 | 1,008 | 1,090 | 1,168 |
| Midwest | 1,160 | -16.5 | 1,100 | 1,390 | 1,331 | 1,491 | 1,589 |
| South | 1,910 | -17.0 | 1,920 | 2,300 | 2,240 | 2,576 | 2,704 |
| West | 1,020 | -12.8 | 1,000 | 1,170 | 1,093 | 1,353 | 1,617 |
| Single-Family | 4,410 | -14.5 | 4,340 | 5,160 | 4,958 | 5,703 | 6,181 |
| Median Price, Total, $ | 208,600 | -6.3 | 201,200 | 219,900 | 216,617 | 222,000 | 218,217 |
by Tom Moeller June 26, 2008
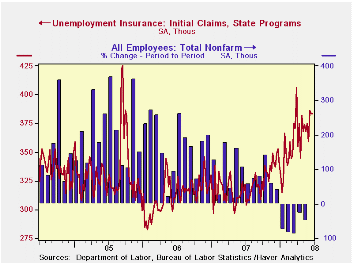
Initial unemployment insurance claims were unchanged last week at 384,000 versus the prior week that was revised up slightly. Consensus expectations had been for 377,000 claims.
A claims level below 400,000 typically has been associated
with growth in nonfarm payrolls. During the last ten years there has
been a (negative) 76% correlation between the level of initial claims
and the m/m change in nonfarm payroll employment.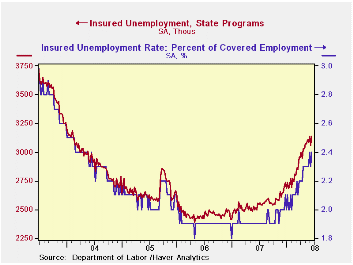
The four-week moving average of initial claims rose week-to-week to 378,250 (19.7% y/y). Claims averaged 369,000 during May. The numbers compare to March when initial claims averaged 375,000.
Continuing claims for unemployment insurance made up the prior week's little revised decline and rose 82,000. The four-week average of continuing claims rose to a new cycle high of 3,103,250.
Continuing claims provide some indication of workers' ability to find employment and they lag the initial claims figures by one week.
The insured rate of unemployment rose back to its cycle high of 2.4%.
| Unemployment Insurance (000s) | 06/21/08 | 06/14/08 | Y/Y | 2007 | 2006 | 2005 |
|---|---|---|---|---|---|---|
| Initial Claims | 384 | 384 | 21.9% | 322 | 313 | 331 |
| Continuing Claims | -- | 3,139 | 25.6% | 2,552 | 2,459 | 2,662 |
by Robert Brusca June 26, 2008
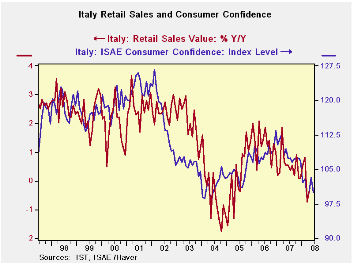
Italy’s retail sales and consumer confidence are in sync or
perhaps I should say ‘in sink’, since sinking it what they are both
doing.
Italy’s retail sales in real terms are falling at a 5.1%
annual rate in 2008-Q1, that is one month into the new quarter. In
April real sales fell by 0.2% while nominal sales were flat. Yr/Yr real
retail sales are off by 0.9%.
In general consumer data in the Zone have been weak and the
industrial data have been relatively stronger. Normally with such weak
consumer data we would be staring straight at recession. In this
business cycle it is still not clear that recession is either
inevitable or avoidable. Among the large EMU countries Italy has been
the weakest. Conditions in the Zone remain touch and go with problems
that span construction, a strong euro exchange rate, financial turmoil
and the dual and opposite depressing and inflation-making impact of
high oil prices.
| Italy Retail Sales Growth Rates | ||||||||
|---|---|---|---|---|---|---|---|---|
| mo/mo % | At annual rates | |||||||
| Nominal | Apr-08 | Mar-08 | Feb-08 | 3-MO | 6-MO | 12-MO | YrAGo | Q-2-Date |
| Retail Trade | 0.0% | -0.6% | 0.3% | -1.5% | -1.1% | -0.4% | 0.6% | -2.0% |
| Food Beverages & Tobacco | 0.0% | -0.4% | 0.4% | 0.0% | 0.2% | 0.9% | 0.4% | -0.8% |
| Clothing & Furniture | -4.1% | -2.8% | 1.4% | -20.2% | -11.8% | -4.9% | 0.0% | -28.6% |
| Total Real Retail | -0.2% | -1.1% | 0.2% | -4.3% | -5.0% | -3.6% | -0.9% | -5.1% |
by Robert Brusca June 26, 2008

The pecking order is disturbed
EMU orders are yet another example of enigmatic E-zone data. Country
level performance is really uneven and this month the strongest economy
(Germany) is showing the weakest results as EMU orders show unexpected
strength. Can we believe it? I don’t think so.
Volatile orders with incongruent results
EMU orders have become volatile first of all and that argues against
making any hasty judgments about trends. After a flat February and a
1.3% drop in March, orders have SURGED in EMU in April rising by 2.5%.
This is with MFG sales rising m/m by 0.1%, 0% and 0.1% in each of the
past three months. Moreover the gains are in intermediate goods the
most strongly and secondly in capital goods. But capital goods strength
is suspect as a trend since Germany dominates that category and in
April German orders fell for the third month in a row.
Results of Biblical proportions: the first shall be last and
the last shall be first
France and Italy are showing the greatest order strength over the past
three and six months and this simply not a believable result as German
orders have contracted. It is simply not credible as a trend, only as a
fluke.
Domestic orders greatest in countries where domestic stress
has been among the highest?
The order breakdown for the Zone shows that domestic orders are holding
up the best, rising by 4.8% in April as foreign orders fell by 0.5%;
Over three months foreign orders are off at a 6.6% pace, over six
months they are down at a 1.4% pace. Meanwhile over that period EMU
domestic orders have accelerated.
Too much of this report simply fails the credibility test
This is not a believable pattern. Domestically consumption has been
hurt across the zone and banking sector problems linger. If the
external sector is showing collapsing orders the EMU domestic economy
will be having trouble as well. There may have been some domestic
programs ion Italy and France that have sustained demand early in the
second quarter, but it is nothing fundamental. In both of those
countries the consumer sector is challenged and services surveys have
been withering. It is hard to understand the spurt in EMU orders in
April and that is no reason to believe it especially given the
composition of orders across products and across countries. This is a
report that is best set aside for a while to await revision or more
context.
| E-zone-13 and UK Industrial Orders And Sales | |||||||||
|---|---|---|---|---|---|---|---|---|---|
| Saar except m/m | Mo/Mo | Apr 08 |
Mar 08 |
Apr 08 |
Mar 08 |
Apr 08 |
Mar 08 |
||
| E-Zone Detail | Apr 08 |
Mar 08 |
Feb 08 |
3Mo | 3Mo | 6Mo | 6Mo | 12Mo | 12Mo |
| MFG Orders | 2.5% | -1.3% | 0.0% | 4.8% | 4.0% | 2.9% | 3.5% | 6.1% | 2.2% |
| MFG Sales | 0.1% | -0.2% | 0.6% | 2.4% | 7.4% | 5.5% | 5.2% | 4.6% | 4.8% |
| Consumer Goods | 0.1% | 0.0% | 0.1% | 0.8% | 1.0% | 1.4% | 1.4% | 2.4% | 2.6% |
| Capital Goods | 0.4% | 0.4% | 0.7% | 6.2% | 7.7% | 6.1% | 5.8% | 6.0% | 6.2% |
| Intermediate Goods | 4.8% | -2.1% | 0.6% | 13.7% | 3.6% | 6.1% | 5.5% | 7.5% | 2.3% |
| Memo: MFG | |||||||||
| Total Orders | 2.5% | -1.3% | 0.0% | 4.8% | 4.0% | 2.9% | 3.5% | 6.1% | 2.2% |
| E-13 Domestic MFG orders | 4.8% | -2.1% | 0.6% | 13.7% | 3.6% | 6.1% | 5.5% | 7.5% | 2.3% |
| E-13 Foreign MFG orders | -0.5% | -0.8% | -0.5% | -6.6% | 9.7% | -1.4% | 4.5% | 5.5% | 3.9% |
| Countries: | Apr 08 |
Mar 08 |
Feb 08 |
3Mo | 3Mo | 6mo | 6mo | 12mo | 12mo |
| Germany (MFG) | -1.1% | -0.8% | -0.1% | -7.9% | -3.6% | -1.8% | 8.9% | 5.1% | 5.5% |
| France (Ind) | 5.2% | -6.4% | 1.6% | 0.3% | -0.7% | 2.8% | -0.3% | 6.6% | -1.2% |
| Italy (Ind) | 1.2% | -0.5% | 2.2% | 12.3% | 18.2% | 6.0% | 1.1% | 6.5% | 4.0% |
| UK (Engineering Ind) | 20.3% | -14.2% | -8.9% | -22.0% | -23.4% | 30.2% | -20.4% | 13.0% | -11.9% |
by Robert Brusca June 26, 2008
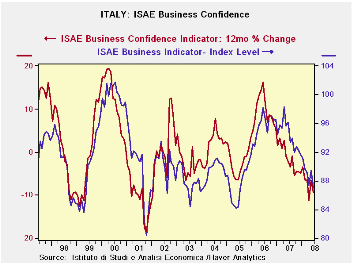
In recent months Italy’s business confidence has been chopping around its current level but this is now the lowest reading of this cycle. In May Euro-data both Italy and France scored order increases that were quite strong by the Zone’s standards. But, in this June report, it is clear that both domestic and foreign orders are under downward pressure. Total domestic orders lie in the bottom quartile of their range and total foreign orders reside in the bottom third of their range.
Sector performance does differ quite a lot. For investment goods the picture is quite different. Investment goods’ foreign orders are actually above their 10 year average and reside in the top 40% of their range Domestic orders for investment goods still stand in the bottom 40% of their range. So the investment goods sector is still performing quite adequately, led by exports. May and June are a marked improvement over April’s low point for foreign orders. But domestic investment good orders continue to be depressed. For consumer goods the picture is bleak for both domestic and foreign orders. Both series remain depressed. Domestic orders are in the bottom 16 percentile of their range and foreign orders are in the bottom 21 percentile of their range.
Production characteristics are…Production overall is in the bottom third of its range with investment goods in the bottom 45th percentile of their range and consumer goods in the bottom quarter of their range. Italy’s investment goods sector is doing best overall held by strength overseas. All signs point to a weak domestic economy, however. Consumer goods are weak and the intermediate sector is as you would expect in the middle of these trends. But only the investment goods sector is performing above par but with its production trend slipping and inventories high by historic standards. Italy is a troubled economy.
<| Italy ISAE Business Sentiment | ||||||
|---|---|---|---|---|---|---|
| Since January 1999 | ||||||
| Jun-08 | May-08 | Apr-08 | Mar-08 | Percentile | Rank | |
| Biz Confidence | 87.1 | 89.4 | 87.4 | 89.1 | 31.3 | 93 |
| TOTAL INDUSTRY | ||||||
| Order books & Demand | ||||||
| Total | -18 | -16 | -18 | -16 | 26.2 | 82 |
| Domestic | -21 | -16 | -20 | -16 | 23.8 | 88 |
| Foreign | -19 | -16 | -20 | -17 | 31.8 | 69 |
| Inventories | 9 | 6 | 5 | 3 | 83.3 | 13 |
| Production | -12 | -10 | -14 | -11 | 30.6 | 75 |
| INTERMEDIATE | ||||||
| Order books & Demand | ||||||
| Total | -19 | -15 | -18 | -17 | 30.9 | 82 |
| Domestic | -21 | -17 | -19 | -16 | 30.2 | 84 |
| Foreign | -24 | -14 | -17 | -19 | 28.8 | 89 |
| Inventories | 14 | 8 | 6 | 4 | 100.0 | 1 |
| Production | -13 | -13 | -13 | -13 | 31.0 | 67 |
| INVESTMENT GOODS | ||||||
| Order books & Demand | ||||||
| Total | -2 | -3 | -13 | 1 | 53.4 | 44 |
| Domestic | -16 | -10 | -18 | -6 | 38.8 | 62 |
| Foreign | 1 | -3 | -14 | 0 | 60.7 | 35 |
| Inventories | 12 | 6 | 6 | 0 | 78.4 | 12 |
| Production | -1 | 2 | -4 | 3 | 45.5 | 45 |
| CONSUMER GOODS | ||||||
| Order books & Demand | ||||||
| Total | -19 | -18 | -23 | -22 | 22.7 | 87 |
| Domestic | -22 | -20 | -23 | -23 | 16.7 | 94 |
| Foreign | -25 | -22 | -26 | -20 | 21.3 | 98 |
| Inventories | 4 | 7 | 3 | 3 | 57.7 | 64 |
| Production | -16 | -15 | -21 | -18 | 25.0 | 92 |
| Total number of months: 114 | ||||||
by Robert Brusca June 26, 2008

The French household confidence index fell to -46 in June from -42 in May. This series goes back to January of 1990. Since then there are 222 observations. This index is the lowest on this period. Living standards over the last 12 months and the coming 12 months were and are expected to be the worst of this period. The past and future financial situations are also the worst on record. The ability to save over the next twelve months is the second worst on record. The ability to spend is the second worst on record. In contrast price developments are rated as the highest on record for this period.
The current financial situation is rated in the bottom quartile of its range. Unemployment prospects are only mid-range and improved a tic from last month. Still, these two months are the worst unemployment readings since December of 2006 even though they are mid-range.
| INSEE Household Monthly Survey | ||||||
|---|---|---|---|---|---|---|
| Since Jan 1990 | ||||||
| Jun-08 | May-08 | Apr-08 | Mar-08 | Percentile | Rank | |
| Household Confidence | -46 | -42 | -38 | -37 | 0.0 | 222 |
| Living Standards | ||||||
| past 12 Mos | -78 | -75 | -71 | -71 | 0.0 | 222 |
| Next 12-Mos | -57 | -50 | -44 | -41 | 0.0 | 222 |
| Unemployment: Next 12 | 17 | 18 | 5 | 11 | 49.1 | 142 |
| Price Developments | ||||||
| Past 12Mo | 66 | 66 | 58 | 60 | 100.0 | 1 |
| Next 12-Mos | -28 | -34 | -35 | -41 | 35.2 | 52 |
| Savings | ||||||
| Favorable to save | 20 | 21 | 24 | 25 | 44.4 | 145 |
| Ability to save Next 12 | -21 | -20 | -13 | -17 | 6.9 | 221 |
| Spending | ||||||
| Favorable for major purchase | -37 | -33 | -30 | -29 | 8.6 | 221 |
| Financial Situation | ||||||
| Current | 8 | 10 | 11 | 12 | 23.8 | 172 |
| Past 12 MOs | -35 | -33 | -30 | -31 | 0.0 | 222 |
| Next 12-Mos | -23 | -19 | -17 | -15 | 0.0 | 222 |
| Number of observations in the period: 222 | ||||||

Tom Moeller
AuthorMore in Author Profile »Prior to joining Haver Analytics in 2000, Mr. Moeller worked as the Economist at Chancellor Capital Management from 1985 to 1999. There, he developed comprehensive economic forecasts and interpreted economic data for equity and fixed income portfolio managers. Also at Chancellor, Mr. Moeller worked as an equity analyst and was responsible for researching and rating companies in the economically sensitive automobile and housing industries for investment in Chancellor’s equity portfolio. Prior to joining Chancellor, Mr. Moeller was an Economist at Citibank from 1979 to 1984. He also analyzed pricing behavior in the metals industry for the Council on Wage and Price Stability in Washington, D.C. In 1999, Mr. Moeller received the award for most accurate forecast from the Forecasters' Club of New York. From 1990 to 1992 he was President of the New York Association for Business Economists. Mr. Moeller earned an M.B.A. in Finance from Fordham University, where he graduated in 1987. He holds a Bachelor of Arts in Economics from George Washington University.
More Economy in Brief


