 Global| Aug 13 2004
Steady Growth in European GDP; Japanese Figure Disappoints
Summary
As partially described here yesterday, Europe continued a steady growth pace in Q2, according to the "flash estimate" compiled by Eurostat, the Euro-Zone statistical agency. The original group, the EU-12saw 0.5% GDP growth in the [...]
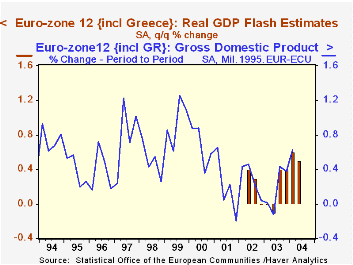
As partially described here yesterday, Europe continued a steady growth pace in Q2, according to the "flash estimate" compiled by Eurostat, the Euro-Zone statistical agency. The original group, the EU-12saw 0.5% GDP growth in the quarter, and the expanded EU-25, 0.6%.
These "flash" estimates are preliminary. They are based on early summary measures produced in some of the countries, and model extrapolations for the remaining members. Actual data included in today's EU-12 figure come from Belgium, Germany, Greece, France, Italy, the Netherlands and Finland. Some incomplete Spanish data are also used. No details on the components are available, as we described yesterday for Germany and France.
The EU-25 adds actual data for Sweden and the UK, both of which had 0.9% GDP gains in Q2. This was sufficient to make the EU-25 total 0.6%, a notch higher than the EU-12 number. Obviously, many other countries are yet to be added to this compilation. 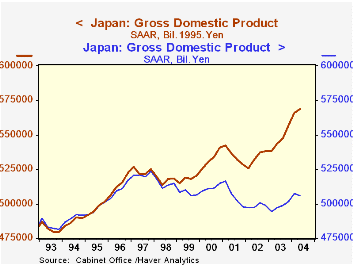
Elsewhere, Japan's GDP for Q2 was disappointingly weak. It grew just 0.4% in the quarter, much slower than the 1.4% projected by analysts and also weaker than Q1's 1.6%. The Cabinet Office published component information; it shows that consumer spending slowed to a 0.6% increase from 1.1% and that business investment was virtually flat after 1.1% in Q1 and 6.6% in Q4 2003.
These figures for Japan appeared distressful for analysts cited in press reports today. Even so, the year-on-year gain in business plant and equipment was 8.1%, nearly twice as much as the 20-year average of 4.1%. And, as is clear in the graph, the investment component is very volatile, making it hard to predict and reducing the import of any single quarter's result. Overall GDP, with a 4.4% year-on-year move, was also markedly stronger than its 20-year average of 2.6%. [Detailed components for the total Euro-Zone GDP accounts will be reported by Eurostat on September 7.]
| Percent Changes | Qtr/QtrYear/ Year | 4th Qtr/4th Qtr||||||
|---|---|---|---|---|---|---|---|
| 2nd Qtr 2004 | 1st Qtr 2004 | 4th Qtr 2003 | 2003 | 2002 | 2001 | ||
| Euro-Zone 12 | 0.5 | 0.6 | 0.4 | 2.0 | 0.7 | 1.1 | -0.1 |
| Euro-Zone 25 | 0.6 | 0.6 | 0.5 | 2.2 | 1.1 | ||
| Japan | 0.4 | 1.6 | 1.8 | 4.4 | 3.1 | 1.7 | -2.1 |
Carol Stone, CBE
AuthorMore in Author Profile »Carol Stone, CBE came to Haver Analytics in 2003 following more than 35 years as a financial market economist at major Wall Street financial institutions, most especially Merrill Lynch and Nomura Securities. She had broad experience in analysis and forecasting of flow-of-funds accounts, the federal budget and Federal Reserve operations. At Nomura Securities, among other duties, she developed various indicator forecasting tools and edited a daily global publication produced in London and New York for readers in Tokyo. At Haver Analytics, Carol was a member of the Research Department, aiding database managers with research and documentation efforts, as well as posting commentary on select economic reports. In addition, she conducted Ways-of-the-World, a blog on economic issues for an Episcopal-Church-affiliated website, The Geranium Farm. During her career, Carol served as an officer of the Money Marketeers and the Downtown Economists Club. She had a PhD from NYU's Stern School of Business. She lived in Brooklyn, New York, and had a weekend home on Long Island.
More Economy in Brief


