 Global| Dec 30 2020
Sporadic European PPI Data Show Some Inflation
Summary
European inflation trends are showing some life, but it is still not much life. It is sporadic and seems to be driven mostly by the oil price cycle, a cycle that is still not looking so good into 2021 so there is probably not much to [...]
 European inflation trends are showing some life, but it is still not much life. It is sporadic and seems to be driven mostly by the oil price cycle, a cycle that is still not looking so good into 2021 so there is probably not much to worry about here.
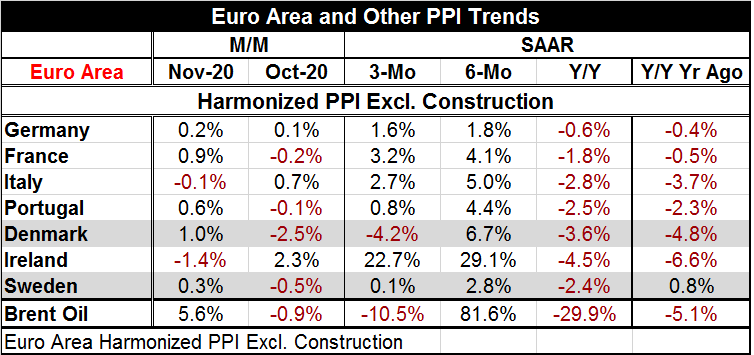
The graph shows the recent convoluted changes in the clearest light. Inflation plunged in 2019 and 2020, but it is now reviving from its lows. Inflation is still not showing positive year-on-year gains, but the year-on-year drops are getting smaller. The table focuses more on the actual growth rates and especially on the growth rates of 12 months and less. The table reminds us that year-on-year growth rates for this mixed group of early PPI inflation reporters ranges from -4.5% in Ireland to -0.6% in Germany. As always in Europe and often within the EMU itself, there is a range of outcomes.
Over six months all countries in the table experience inflation acceleration compared to their individual 12-month pace. All show inflation increases over six months in sharp contrast to the 12-month across the board declines. Over six months compared to 12 months, Brent oil prices accelerated by 111.5% (81.6%-29.9%) while Ireland and Denmark posted double-digit acceleration on this comparison. Germany experienced the smallest acceleration of 2.4% as the inflation rate rose to 1.8% over six months from -0.6% over 12 months.
Over three months there is another shifting of gears as inflation rates fell across the board compared to their respective six-month performance. Brent oil prices provide the key impulse as they decelerate at 92.1% pace (-10.5-81.6) from six-months to three-months. This pulse again seems to be the dominating influence across European countries whether they are EMU members or not.
Setting aside the clear link to oil prices, inflation rates over six months range from 29.1% in Ireland to 1.8% in Germany. Over three months, the range is from 22.7% in Ireland to 0.1% in Sweden. On both the six-month and three-month timelines, Ireland is a clear outlier. The graph shows only three countries, but there it is easy to see the clear common progression of annual inflation rates with the major cycle movements dominating despite some country level differences. On that chart, Italy persistently has the most extreme movements and Germany has the least extreme movements.
However, in October and November, the monthly results are seemingly random. In October, four of seven countries show prices falling compared to only two of seven in November. In October two countries log gains of over 0.5% on the month while in November three countries go over that hurdle. Prices are simultaneously falling and rising too fast across the region in various places. The ‘lesson’ here is that in the very short term price dynamics can look like chaos even though they are much more tractable over longer periods.
The unifying theme still seems to be in terms of price changes and linked to the path of oil prices. Looking at a full slate of 15 European countries, Brent has a correlation with ex-construction PPI changes over 12 months that is in excess of 0.5 in all by 5 countries; of these, only Denmark and Sweden are represented in the table above. For the other countries in the table, the correlations with Brent for year-on-year percentage changes ranges from 0.78 to 0.90. This underscores the role of oil in driving these price changes. Ireland and Portugal are the countries in this mix that have the highest correlations with Brent at correlation values of nearly 0.9. Germany, France and Italy have correlations of 0.78. In contrast, Sweden and Demark have correlations of about 0.4.
Global growth is still impeded and there will not be a growth surge driving oil or other prices higher any time soon. While vaccines are being distributed, vaccinating a large proportion of each country’s population is a herculean effort that is all but certain to go more slowly than planned. Global growth should improve in 2021, but the process will not be anything like the snap back witnessed in Q2 of 2020.

Robert Brusca
AuthorMore in Author Profile »Robert A. Brusca is Chief Economist of Fact and Opinion Economics, a consulting firm he founded in Manhattan. He has been an economist on Wall Street for over 25 years. He has visited central banking and large institutional clients in over 30 countries in his career as an economist. Mr. Brusca was a Divisional Research Chief at the Federal Reserve Bank of NY (Chief of the International Financial markets Division), a Fed Watcher at Irving Trust and Chief Economist at Nikko Securities International. He is widely quoted and appears in various media. Mr. Brusca holds an MA and Ph.D. in economics from Michigan State University and a BA in Economics from the University of Michigan. His research pursues his strong interests in non aligned policy economics as well as international economics. FAO Economics’ research targets investors to assist them in making better investment decisions in stocks, bonds and in a variety of international assets. The company does not manage money and has no conflicts in giving economic advice.
More Economy in Brief


