 Global| Aug 27 2007
Spain’s PPI: Eases Monthly Pace in July but Still Too Strong
Summary
Spain's price trends show tempered results only for investment goods. Overall PPI inflation is stronger over three months than for year/year trends. Intermediate goods trends are firm at around a 6% pace. Consumer goods price trends [...]
Spain's price trends show tempered results only for investment goods. Overall PPI inflation is stronger over three months than for year/year trends. Intermediate goods trends are firm at around a 6% pace. Consumer goods price trends are accelerating.
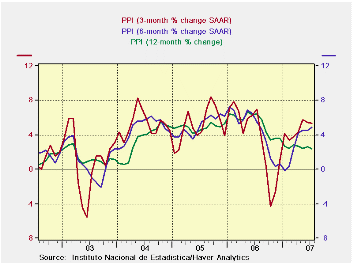
The impact of these various trends on the overall PPI is depicted in the sequential growth rate chart on the left. Year/year inflation is ever so gradually edging lower. But over 6 months and 3 months, inflation has flared to a stronger pace and to a pace that is above the year/year pace. That is usually a prescription for year/year acceleration as well. While not the largest of the Euro economies, Spain is still significant. Its price trends will not be encouraging to the ECB. But then again this is only the PPI not the favored CPI measure (HICP).
| m/m | Saar | ||||||
| SPAIN | Jul-07 | Jun-07 | May-07 | 3-Mo | 6-Mo | Yr/Yr | Y/Y Yr Ago |
| Total | 0.3% | 0.4% | 0.6% | 5.4% | 4.9% | 2.3% | 6.4% |
| Consumer Goods | 0.2% | 0.2% | 0.0% | 6.9% | 2.9% | 1.8% | 3.5% |
| Intermediate Goods | 0.3% | 0.6% | 0.6% | 6.0% | 6.5% | 5.5% | 7.0% |
| Investment Goods | 0.2% | 0.0% | 0.4% | 2.1% | 2.7% | 3.0% | 2.4% |
| HIPPX Constructions | -- | 0.5% | 0.6% | #N/A | #N/A | #N/A | 6.4% |
by Louise Curley August 27, 2007
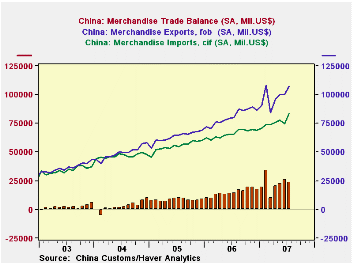
China's trade surplus declined by $2,426 million from June to $23,294 million in July, but it was still the third highest on record. Exports were up by $6,894 million but imports rose by $9,320 million. Data on the trade balance, exports and imports are shown in the first chart.
China's balance of trade with Japan continues to show surplus, while that with Europe and the United States show large deficits. There has been some decline in the deficits with the U. S. and Europe since February of this year, but the declines have been small. The second chart shows the balance of trade with Japan, the U. S. and Europe.
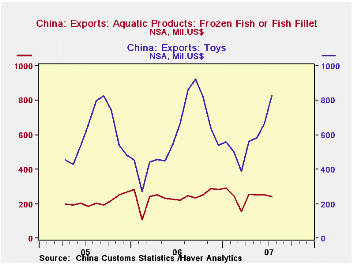
The July data on China's exports to the U. S. are probably too soon to reflect any impact of the spate of recalls and questions about the quality of some of its exports, notably frozen fish, tooth paste, toys and blankets. As the third chart shows, July exports of toys to the U. S. were up and exports of frozen fish were flat. 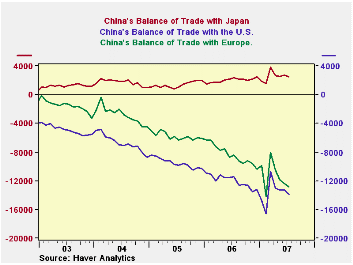
| CHINA | Jul 07 | Jun 07 | Jul 06 | M/M Dif | Y/Y Dif | 2006 | 2005 | 2004 |
|---|---|---|---|---|---|---|---|---|
| Exports | 107115 | 100221 | 79927 | 6894 | 27189 | 968950 | 761953 | 593327 |
| Imports | 83821 | 47501 | 65677 | 9320 | 18144 | 791473 | 659959 | 561228 |
| Balance | 23294 | 25720 | 14250 | -2426 | 9044 | 177477 | 101999 | 32094 |
| Exports to: | ||||||||
| Japan | 8946 | 7992 | 7331 | 954 | 1614 | 91723 | 84097 | 73536 |
| U.S. | 19791 | 18799 | 16613 | 993 | 3178 | 203516 | 162938 | 124973 |
| Europe | 22152 | 23321 | 18042 | -1169 | 4110 | 215310 | 165678 | 122923 |
| Imports from: | ||||||||
| Japan | 11373 | 10730 | 9673 | 643 | 1700 | 115811 | 100468 | 94192 |
| U.S. | 5879 | 5504 | 5130 | 376 | 749 | 59223 | 48735 | 44653 |
| Europe | 9370 | 10888 | 9614 | -1518 | -244 | 114877 | 96403 | 88731 |
by Tom Moeller August 27, 2007
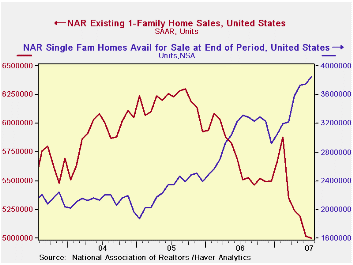
Sales of existing homes fell again in July to 5.750M units. Though the decline of 0.2% from a revised 5.76M in June was slight, it still amounted to the lowest level since 2002 and was down 9.0% from the year earlier level. Sales were down 20.2% from the peak during September of 2005. Sales of 5.70M were expected by the Consensus of economists.
Sales of single family homes fell 0.4% last month to 5.0M after a revised 3.3% decline in June. Sales were 20.6% below the peak month of September 2005.
By region, single family home sales rose 1.4% (-2.7% y/y) in the Northeast but n the West sales rose 1.0% (-15.5% y/y) in July. Sales in the Midwest slipped 1.6% (-4.8% y/y) and down South sales slipped 1.0% (-10.4% y/y).
The inventory of single family "homes on the market" rose 2.7% (16.3%.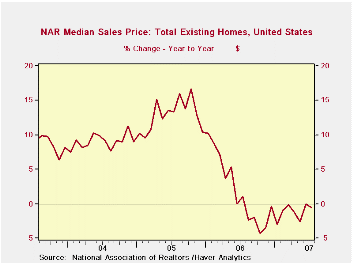
The median price of an existing single family home slipped 0.3% and versus last year fell 1.0%.
The broad aggregate data on existing home sales are included in Haver's USECON database; details about prices by region and inventories are available in the REALTOR database.
International Trade: A Larger Piece of the Economic Pie from the Federal Reserve Bank of Atlanta is Available here.
| Existing Home Sales (SAAR, 000s) | July | June | Y/Y | 2006 | 2005 | 2004 |
|---|---|---|---|---|---|---|
| Total Sales | 5,750 | 5,760 | -9.0% | 6,510 | 7,065 | 6,727 |
| Single-Family Sales | 5,000 | 5,020 | -9.3% | 5,708 | 6,182 | 5,914 |
| Median Single-Family Home Price (NSA,000s) | $228.6 | $229.2 | -1.0% | $221.9 | $217.5 | $192.8 |

Robert Brusca
AuthorMore in Author Profile »Robert A. Brusca is Chief Economist of Fact and Opinion Economics, a consulting firm he founded in Manhattan. He has been an economist on Wall Street for over 25 years. He has visited central banking and large institutional clients in over 30 countries in his career as an economist. Mr. Brusca was a Divisional Research Chief at the Federal Reserve Bank of NY (Chief of the International Financial markets Division), a Fed Watcher at Irving Trust and Chief Economist at Nikko Securities International. He is widely quoted and appears in various media. Mr. Brusca holds an MA and Ph.D. in economics from Michigan State University and a BA in Economics from the University of Michigan. His research pursues his strong interests in non aligned policy economics as well as international economics. FAO Economics’ research targets investors to assist them in making better investment decisions in stocks, bonds and in a variety of international assets. The company does not manage money and has no conflicts in giving economic advice.
More Economy in Brief


