 Global| Oct 26 2009
South Korea Reports 3Q GDP
Summary
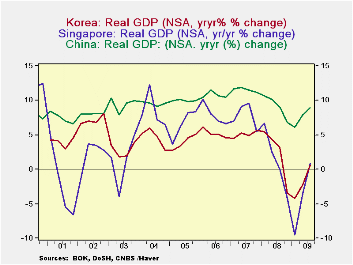
South Korean joins China and Singapore among the emerging economies of the Pacific Rim to report third quarter GDP. GDP growth in the three countries is shown in the first chart. The declines in the economies of Korea and Singapore [...]
 South Korean
joins China and Singapore among the emerging economies of the Pacific
Rim to report third quarter GDP. GDP growth in the three
countries is shown in the first chart. The declines in the
economies of Korea and Singapore have been much more severe than those
in China. China has not experienced a year to year decline in
GDP, merely a deceleration of growth. At their low points in
the first quarter of this year, GDP in Singapore was 9.5% below the
year ago figure and GDP in Korea, 4.3% below.
South Korean
joins China and Singapore among the emerging economies of the Pacific
Rim to report third quarter GDP. GDP growth in the three
countries is shown in the first chart. The declines in the
economies of Korea and Singapore have been much more severe than those
in China. China has not experienced a year to year decline in
GDP, merely a deceleration of growth. At their low points in
the first quarter of this year, GDP in Singapore was 9.5% below the
year ago figure and GDP in Korea, 4.3% below.
Korea reported that GDP grew 2.9% in the third quarter on a seasonally adjusted basis, compared with 2.7% in the second quarter. On a seasonally unadjusted basis, GDP was 0.6% above the year ago figure, the first positive figure since the third quarter of 2008.
 A swing in inventories from a liquidation of 4,506 million won* in the
second quarter to an accumulation of 6,486 won in the third quarter was
the main factor in the third quarter strength. However, this
should not be a cause of concern at this point in the business
cycle. The rise follows three successive quarters of big
liquidations, beginning in the fourth quarter of 2008--7,290 million
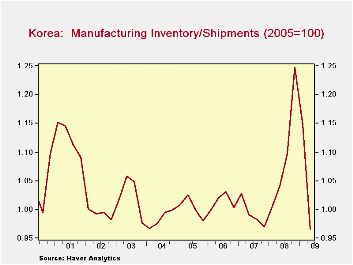
won 6,788 million won and 4,506 million wan. The inventory to
shipments ratio for manufacturing at the end of the second quarter was
.97 down from 1.25 at the end of 2008. As can be seen in the
second chart, the I/S ratio for manufacturing was somewhat below normal
at the end of the second quarter so that a build up in the third
quarter is not unexpected.
A swing in inventories from a liquidation of 4,506 million won* in the
second quarter to an accumulation of 6,486 won in the third quarter was
the main factor in the third quarter strength. However, this
should not be a cause of concern at this point in the business
cycle. The rise follows three successive quarters of big
liquidations, beginning in the fourth quarter of 2008--7,290 million
won 6,788 million won and 4,506 million wan. The inventory to
shipments ratio for manufacturing at the end of the second quarter was
.97 down from 1.25 at the end of 2008. As can be seen in the
second chart, the I/S ratio for manufacturing was somewhat below normal
at the end of the second quarter so that a build up in the third
quarter is not unexpected.
 The performance of the other components of
GDP was generally typical of that seen in the early stages of
recovery--some increases and some retrenchments. The one
notable exception was a greater decline in exports of goods and
services, than that in imports of goods and services, with the result
that the balance on goods and services declined from 20.3 billion won
in the second quarter to 19.1 billion won . In the past,
exports have been a dynamic element in the growth of the Korean economy
and generally quick to respond to improvements in the world economy.
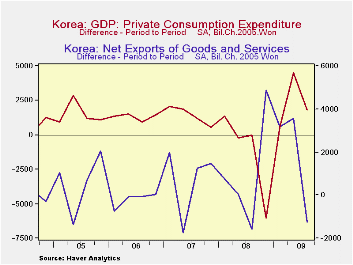
Private consumption increased by 3,524.7 million won in the third
quarter compared with an increase of 1,367.1, this could be an sign
that Korea is beginning to shift away from its policy of export led
growth but it is probably not too wise to base a conclusion on one
quarter's evidence. See the third chart. There were small
declines in construction, fixed investment in intangible
assets and government consumption and the change in business investment
in plant and equipment was essentially unchanged at 1,778 million won
in the third quarter, compared with a rise of 1,846 million won in the
second quarter.
The performance of the other components of
GDP was generally typical of that seen in the early stages of
recovery--some increases and some retrenchments. The one
notable exception was a greater decline in exports of goods and
services, than that in imports of goods and services, with the result
that the balance on goods and services declined from 20.3 billion won
in the second quarter to 19.1 billion won . In the past,
exports have been a dynamic element in the growth of the Korean economy
and generally quick to respond to improvements in the world economy.
Private consumption increased by 3,524.7 million won in the third
quarter compared with an increase of 1,367.1, this could be an sign
that Korea is beginning to shift away from its policy of export led
growth but it is probably not too wise to base a conclusion on one
quarter's evidence. See the third chart. There were small
declines in construction, fixed investment in intangible
assets and government consumption and the change in business investment
in plant and equipment was essentially unchanged at 1,778 million won
in the third quarter, compared with a rise of 1,846 million won in the
second quarter.
*The won in all cases is the 2005 chained won.
| SOUTH KOREA | Q3 09 | Q2 09 | Q1 09 | Q4 08 | Q3 08 | Q2 08 | Q1 08 | 2008 | 2007 |
|---|---|---|---|---|---|---|---|---|---|
| GDP | |||||||||
| Q/Q Change (SA) | 2.93 | 2.65 | 0.12 | -5.07 | 0.22 | 0.43 | 1.00 | 2.22 | 5.11 |
| Y/Y Change (NSA) | 0.58 | -2.16 | -425 | -3.40 | 3.11 | 4.35 | 5.46 | 2.22 | 5.11 |
| Change in New Exports (Mil. 2005 Chained Won) | -1263 | 3572 | 3175 | 4876 | -1590 | 48 | 756 | 10019 | 6577 |
| Change in Inventory Change " | 6487 | -4506 | -6788 | -7290 | 1396 | 467 | 2004 | 7752 | -2815 |
| Change in Private Consumption " | 3525 | 1367 | -880 | -3189 | 1648 | -3364 | -25 | 4703 | 24655 |
More Economy in Brief


