 Global| May 05 2008
So How Strong is the Euro?
Summary
In recognition of ‘cinco de mayo’ we say ‘MUY FUERTE’ (or very strong) - The chart above displays the JP Morgan broad trade-weighted index value of the euro. In this framework we convert the index to operate as a PPP index, or index [...]
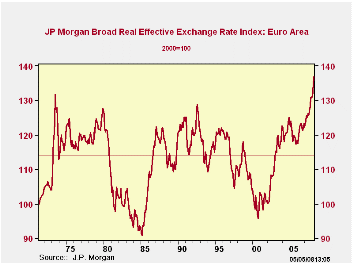
In recognition of ‘cinco de mayo’ we say ‘MUY FUERTE’ (or very strong) - The chart above displays the JP Morgan broad trade-weighted index value of the euro. In this framework we convert the index to operate as a PPP index, or index of purchasing power parity by inserting a line representing its mean value from 1972 onward, after the period of fixed rates ended. Enabled by the assumption that FX markets are reasonably competitive and despite sometimes heavy handed intervention by monetary authorities (especially those that have accumulated large FX reserve balances, thereby thwarting the market mechanism of making the private sector absorb flows or force changes in FX rates when there are imbalances) we appeal to the market mechanism as being one that gets the level of the exchange rate right over the long haul. The period above spans 1972 to 2008. Thus we set the mean of the real weighted dollar index for this period to parity (it lies at 113.8 on the scale) and plot the series. What you get is the chart you see above. As a result the value of 113.8 is the market’s estimate of parity. Above the value of 100 the euro is too high, below it, it is too weak. Right now the euro is too high by some 20%. The highest overvaluation in the period since fixed rate were abolished.
This PPP chart of course plots a ‘euro;’ that did not exist before 1990. To plug that gap a weighting process is used to reconstruct the index for the same group of countries that are in the euro today. Since the European currencies have, for much of this episode, been tethered together in an arrangement called ‘the snake’ (or the snake in a tunnel). I think this treatment is useful for historic comparison.
A similar formulation of the dollar shows that it is undervalued by about 15% on broad currency weighted basis. From that we see that euro seems to have more disequilibrium to deal with on the upside than the dollar does on the downside. And while European data are not uniform in their signals there are some strong hints by local economists, business groups and labor groups and there has been a lot of policymaker squawking to make us think that Europe is indeed suffering from this overvaluation. The data on trade trends are a useful diagnostic.
EU trade is showing the wear and tear of a rising exchange rate. The twelve month growth rates show that European exports are generally decelerating. Among these groups, exports in 2007 decelerated compared to 2006 growth rates in 75% of the destinations without regard to size. With regard to size some 87% of the exports are slowing. The size-weighted slowing has jumped sharply in 2007. This last move up in the euro of about 9% in one year on a trade weighted basis has made a large impact. EMU trade flows are predominately slowing already and we know that the impact from exchanger rate changes embodies lags.
Economic summits have been poor vehicles achieve macroeconomic change in recent years and so they have turned their attention to global issues and to North-South (developed VS undeveloped country) trade issues and tariff reduction. At the last G-7 summit participants came away giving markets very different views of what was waiting for them on the exchange rate front with European participants talking of a strong commitment to limit the dollar’s drop while US officials pointed to the unchanged nature of the langue of the communiqué.
European MFG and consumer data plus the survey data on activity in the EMU and EU areas seem to confirm that slowing is taking root in Europe. The backing off the euro and the dollar from their respective precipices is welcome news. But the Euro still faces some strong challenges and so does growth in Europe.
| EMU12 Export Trends BY Region 12Mo % | ||||||
|---|---|---|---|---|---|---|
| Dec-07 | Dec-06 | Dec-05 | Dec-04 | Dec-03 | SHARE | |
| EU/NonEMU | 5.1% | 19.2% | 18.7% | 10.1% | 8.3% | 23.4% |
| UK | 0.0% | 7.8% | 7.6% | -8.2% | 6.1% | 16.9% |
| Russia | 10.9% | 29.7% | 19.7% | 31.6% | 11.7% | 5.2% |
| Switzerland | -3.0% | 14.1% | 3.8% | 12.1% | -0.2% | 6.2% |
| Turkey | 5.6% | -5.1% | 35.4% | 12.3% | 22.7% | 3.2% |
| US | -17.4% | 5.6% | 21.3% | 0.0% | -6.1% | 14.0% |
| China | 7.9% | 15.4% | 28.2% | 12.4% | 8.3% | 4.5% |
| Japan | -6.0% | -7.0% | 2.9% | 5.8% | 5.6% | 2.4% |
| Other Asia | -8.0% | -7.5% | 2.8% | 5.4% | 5.6% | 2.4% |
| Africa | 8.8% | 4.1% | 19.2% | 8.1% | 2.6% | 6.5% |
| Latin America | 6.5% | 11.4% | 13.3% | 19.4% | -7.7% | 4.6% |
| Other | -3.9% | 11.3% | 7.2% | 7.0% | 18.7% | 10.8% |
| % Slowing | 75.0% | 58.3% | 41.7% | 33.3% | 33.3% | |
| % slowing weighted | 87.6% | 37.8% | 20.8% | 32.4% | 27.8% | |

Robert Brusca
AuthorMore in Author Profile »Robert A. Brusca is Chief Economist of Fact and Opinion Economics, a consulting firm he founded in Manhattan. He has been an economist on Wall Street for over 25 years. He has visited central banking and large institutional clients in over 30 countries in his career as an economist. Mr. Brusca was a Divisional Research Chief at the Federal Reserve Bank of NY (Chief of the International Financial markets Division), a Fed Watcher at Irving Trust and Chief Economist at Nikko Securities International. He is widely quoted and appears in various media. Mr. Brusca holds an MA and Ph.D. in economics from Michigan State University and a BA in Economics from the University of Michigan. His research pursues his strong interests in non aligned policy economics as well as international economics. FAO Economics’ research targets investors to assist them in making better investment decisions in stocks, bonds and in a variety of international assets. The company does not manage money and has no conflicts in giving economic advice.
More Economy in Brief


