 Global| Nov 08 2005
Small Business Optimism Up, Pricing Intentions Cool
by:Tom Moeller
|in:Economy in Brief
Summary
The index of small business optimism from the National Federation of Independent Business (NFIB) jumped 3.7% in October, despite the devastation wreaked by three Hurricanes. The economic outlook brightened as 14% of firms expected the [...]
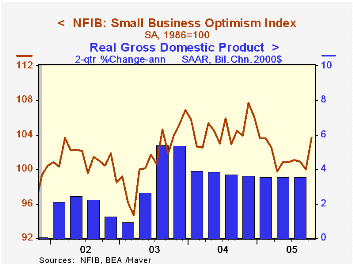
The index of small business optimism from the National Federation of Independent Business (NFIB) jumped 3.7% in October, despite the devastation wreaked by three Hurricanes.
The economic outlook brightened as 14% of firms expected the economy to improve, the best reading since June, although the percentage remained well below the 34-37% range from 2002 to 2004. Plans for adding to employment held steady at 17%, the same as during the last three months. On the negative side, the percentage of firms planning to raise capital expenditures fell back to the lowest level of the year.
During the last ten years there has been a 70% correlation between the level of the NFIB index and the two quarter change in real GDP.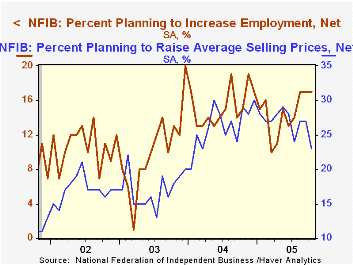
The percentage of firms planning to raise average selling prices fell to 23% from 27% during the prior two months and from 26% during all of last year. The percentage of firm actually raising prices also dipped to 22% from 25% in September but those readings remained up versus 19% averaged in 2004. During the last ten years there has been a 60% correlation between the change in the producer price index and the level of the NFIB price index.
The percentage of firms with one or more job openings fell two points to 21%, last year's average. During the last ten years there has been a 67% correlation between hiring plans and the three month growth in nonfarm payrolls.
About 24 million businesses exist in the United States. Small business creates 80% of all new jobs in America.
The latest press release from the NFIB is available here.
| Nat'l Federation of Independent Business | Oct | Sept | Y/Y | 2004 | 2003 | 2002 |
|---|---|---|---|---|---|---|
| Small Business Optimism Index (1986=100) | 103.7 | 100.0 | -0.2% | 104.6 | 101.3 | 101.2 |
by Tom Moeller November 8, 2005
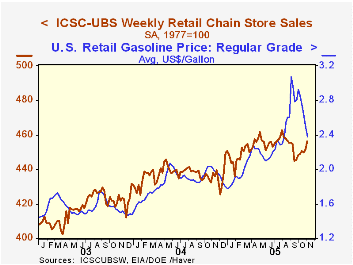
The sales jump was aided by another ten cent drop in the average US retail price of regular gasoline to $2.38 per gallon (+18.7 y/y). Retail gas prices are down 22.5% since the early September peak of $3.07 but during the last several days the spot market price for gasoline has bottomed out, suggesting that further retail price declines will be limited.
During the last ten years there has been a 56% correlation between the y/y change in chain store sales and the change in non-auto retail sales less gasoline, as published by the US Census Department. Chain store sales correspond directly with roughly 14% of non-auto retail sales less gasoline. The leading indicator of chain store sales from ICSC fell 0.6% (-3.4% y/y) during the latest week following an upwardly revised 0.2% gain the prior week.The ICSC-UBS retail chain-store sales index is constructed using the same-store sales (stores open for one year) reported by 78 stores of seven retailers: Dayton Hudson, Federated, Kmart, May, J.C. Penney, Sears and Wal-Mart.
| ICSC-UBS (SA, 1977=100) | 11/05/05 | 10/29/05 | Y/Y | 2004 | 2003 |
|---|---|---|---|---|---|
| Total Weekly Chain Store Sales | 456.1 | 451.6 | 4.1% | 4.6% | 2.9% |
by Tom Moeller November 8, 2005
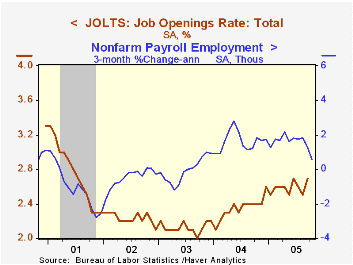
The Bureau of Labor Statistics reported that the job openings rate, from the Job Openings & Labor Turnover Survey (JOLTS), rose in September to 2.7% from 2.5% in August. The job openings rate is the number of job openings on the last business day of the month as a percent of total employment plus job openings. A 190,000 increase (12.6% y/y) in the total number of job openings more than reversed the declines of the prior two months.
The hires rate remained steady at 3.4% for the second consecutive month and equaled the 2004 average. The hires rate is the number of hires during the month divided by employment.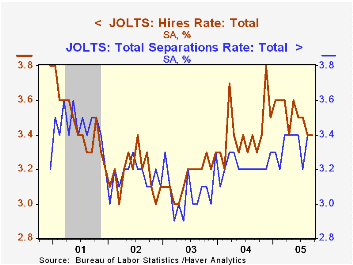
The job separations rate also remained steady at 3.4% but this year's levels have been elevated versus the 3.2% 2004 average. Total separations include quits, layoffs, discharges, and other separations as well as retirements. The total separations, or turnover, rate is the total number of separations during the month divided by employment.
The survey dates only to December 2000 but has since followed the movement in nonfarm payrolls.
A description of the Jolts survey and the latest release from the U.S. Department of Labor is available here.
The Economic Role of Cities in the 21st Century from the Federal Reserve Bank of Philadelphia is available here.
| JOLTS (Job Openings & Labor Turnover Survey) | Sept | Aug | Sept '04 | 2004 | 2003 | 2002 |
|---|---|---|---|---|---|---|
| Job Openings Rate: Total | 2.7% | 2.5% | 2.4% | 2.4% | 2.1% | 2.2% |
| Hires Rate: Total | 3.4% | 3.4% | 3.3% | 3.4% | 3.2% | 3.2% |
by Louise Curley November 8, 2005
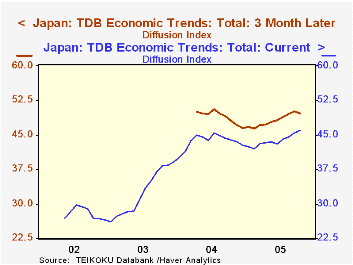
About a week ago, the Japanese Cabinet Office's synthetic indexes of some of the components of Gross Domestic Product intimated that third quarter GDP growth might slow from the second quarter and could even be negative. Another indicator of economic growth was released today by the Teikoku Data Bank, Ltd*. Their monthly survey, conducted over the internet, of more than 20,000 domestic Japanese firms shows how business men appraise current conditions and the prospects of conditions three, six and twelve months ahead.
TDB's economic trends research is a fairly recent endeavor. Data for current conditions are available from May 2002 and those for conditions three, six and twelve months ahead are available only form April, 2004. The first chart shows the available data for the appraisals of current conditions for the whole economy and for conditions expected in three months. Like most survey respondents, respondents to the TDB survey tend to believe things will be better in the future as a result the three month ahead index has generally been higher than that of current conditions. Atypically, however, the October diffusion index of current conditions improved while that for conditions three months ahead declined.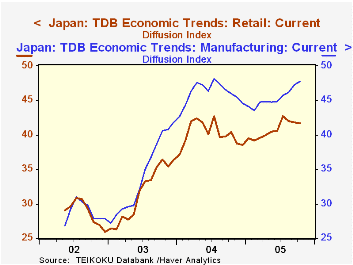
Throughout their limited histories the diffusion indexes in the TDB's economic trends series have rarely been above the 50% mark that would indicates a neutral or positive appraisal of conditions. They have, however, improved from the extreme pessimism of the early years. In addition to an appraisal of economic trends for the economy as a whole, there are appraisals by large and small firms and appraisals for conditions in a number of industries. Small and medium sized firms are becoming less negative on the general outlook. In October the index for current conditions for the economy by small firms rose .67 percentage points or more than the .11 percentage points for the large firms. Two of the industries--manufacturing and retail-for which there are diffusion indexes of current conditions are shown in the second chart. While continued improvement is seen in manufacturing, there is less enthusiasm for the retail sector. In October, the manufacturing index increased by .46 percentage points while that for the retail sector declined by .13 percentage points.
On balance it would seem that the data contained in the TDB's October economic trend series point to a lackluster performance.
| Teikoku Data Bank, Ltd. Economic Trends Diffusion Indexes | Oct 05 | Sep 05 | Oct 04 | M/M Dif | Y/Y Dif | 2004 | 2003 | May 2002 |
|---|---|---|---|---|---|---|---|---|
| Total Economy | ||||||||
| Current conditions | 46.01 | 45.45 | 43.86 | 0.56 | 2.15 | 43.58 | 32.49 | 26.91 |
| Conditions 3-months ahead | 49.71 | 50.11 | 47.99 | -0.40 | 1.72 | |||
| Current Conditions | ||||||||
| Large Firms | 48.35 | 48.24 | 46.13 | 0.11 | 2.22 | 46.21 | 34.16 | 28.45 |
| Small to Medium Firms | 45.22 | 44.55 | 43.11 | 0.67 | 2.11 | 42.72 | 31.93 | 26.38 |
| Manufacturing | 47.76 | 43.30 | 45.96 | 0.46 | 1.80 | 46.05 | 34.18 | 26.90 |
| Retail | 41.70 | 41.83 | 40.36 | -0.13 | 1.34 | 40.21 | 31.59 | 29.00 |

Tom Moeller
AuthorMore in Author Profile »Prior to joining Haver Analytics in 2000, Mr. Moeller worked as the Economist at Chancellor Capital Management from 1985 to 1999. There, he developed comprehensive economic forecasts and interpreted economic data for equity and fixed income portfolio managers. Also at Chancellor, Mr. Moeller worked as an equity analyst and was responsible for researching and rating companies in the economically sensitive automobile and housing industries for investment in Chancellor’s equity portfolio. Prior to joining Chancellor, Mr. Moeller was an Economist at Citibank from 1979 to 1984. He also analyzed pricing behavior in the metals industry for the Council on Wage and Price Stability in Washington, D.C. In 1999, Mr. Moeller received the award for most accurate forecast from the Forecasters' Club of New York. From 1990 to 1992 he was President of the New York Association for Business Economists. Mr. Moeller earned an M.B.A. in Finance from Fordham University, where he graduated in 1987. He holds a Bachelor of Arts in Economics from George Washington University.
More Economy in Brief


