 Global| Jan 08 2008
Small Business Optimism Remained Low
by:Tom Moeller
|in:Economy in Brief
Summary
In December, small business optimism ticked up a slight 0.2% following sharp declines during most of the year according to the National Federation of Independent Business (NFIB). The latest was near the lowest level since September [...]
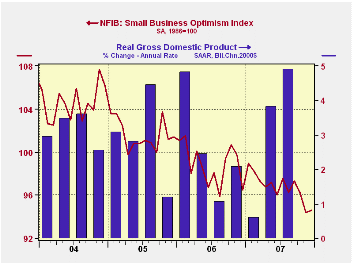
In December, small business optimism ticked up a slight 0.2% following sharp declines during most of the year according to the National Federation of Independent Business (NFIB). The latest was near the lowest level since September 1993.
During the last ten years there has been a 70% correlation between the level of the NFIB index and the two quarter change in real GDP.
Virtually all of last month's slight increase seemed to come as the percentage of firms planning to raise capital expenditures rose off of this cycle's low.
Also, the percent with one or more job openings rose slightly from the lowest level since 2003. During the last ten years there has been a 72% correlation between the NFIB percentage and the y/y change in nonfarm payrolls. The percentage of firms planning to raise employment remained depressed.
The percentage of firms indicating that credit was more difficult to get remained stable after steady increases through 2007.
Now was a good time the business remained near the low of the last three years.
The percentage of firms expecting higher real sales in six months again fell sharply to the lowest since 2003.
Respondents expecting the economy to improve remained near the low of the last two years..The percentage of firms actually raising prices rose m/m. During the last ten years there has been a 60% correlation between the change in the producer price index and the level of the NFIB price index. The percentage of firms planning to raise prices was stable at its highest level in a year.
About 24 million businesses exist in the United States. Small business creates 80% of all new jobs in America.
The Economic Outlook and the Fed's Roles in Monetary Policy and Financial Stability is today's speech by Charles I Plosser, President of the Federal Reserve Bank of Philadelphia and it can be found here.
| Nat'l Federation of Independent Business | December | November | Y/Y | 20007 | 2006 | 2005 |
|---|---|---|---|---|---|---|
| Small Business Optimism Index (1986=100) | 94.6 | 94.4 | -2.0% | 96.7 | 98.9 | 101.6 |
by Tom Moeller January 8, 2008
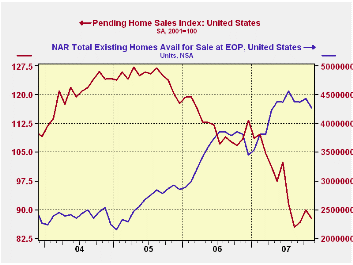
The National Association of Realtors reported that pending home sales in November fell 2.6% m/m and reversed most of the October gain. The level of sales remained down 22.7% year to date.
The latest monthly figure is about one third below the peak level during the Summer of 2005. The data date back only to 2001.
These figures are analogous to the new home sales data from the Commerce Dept. They measure existing home sales when the sales contract is signed, not at the time the sale is closed.
The Realtors also indicated in an earlier report that the number of homes on the market and available for sale fell slightly for the third month in the last four. Nevertheless, the level of 427,300 units was double the level at the low in early 2005.
In the Northeast, pending home sales fell 13.0% m/m and reversed all of the prior month's gain. Sales remained 20% lower than at the start of the year. Sales in the Western part of the nation fell 2.1% m/m. In the Midwest sales fell 4.1% for the second consecutive monthly decline.
Sales in the South posted the only m/m gain with a 2.3% increase but it was only the second rise in the last five months.
The pending home sales data are available in Haver's PREALTOR database and the number of homes on the market are in the REALTOR database.
Housing Woes Weigh Heavily on the Economy from the Federal Reserve Bank of St. Louis can be found here.
| Pending Home Sales (2001=100) | November | October | Y/Y | 2006 | 2005 | 2004 |
|---|---|---|---|---|---|---|
| Total | 87.6 | 89.9 | -19.2% | 112.1 | 124.2 | 120.5 |
| Northeast | 70.1 | 80.6 | -19.1 | 98.0 | 108.0 | 109.2 |
| Midwest | 82.1 | 85.6 | -18.6 | 102.0 | 116.4 | 118.0 |
| South | 100.7 | 98.4 | -19.8 | 127.4 | 134.8 | 126.6 |
| West | 86.6 | 88.5 | -18.5 | 109.6 | 128.7 | 122.7 |
by Tom Moeller January 8, 2008
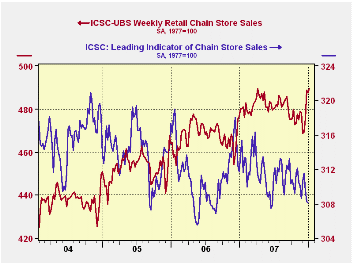
In the opening week of the New Year, chain store sales rose a modest 0.4% according to the International Council of Shopping Centers (ICSC)-UBS.
The small w/w gain was enough to recoup all of the prior week's decline, lift sales to a record high and raise the latest level 1.9% above December after that month's 1.0% m/m rise. During the last ten years there has been a 45% correlation between the y/y change in chain store sales and the change in nonauto retail sales less gasolineThe ICSC-UBS retail chain-store sales index is constructed using the same-store sales (stores open for one year) reported by 78 stores of seven retailers: Dayton Hudson, Federated, Kmart, May, J.C. Penney, Sears and Wal-Mart.
Still working the other way, the leading indicator of chain store sales from ICSC-UBS fell for the third consecutive week was down for all of December for the fourth month in the last five.
The Economy in 2008 is yesterday's speech by Dennis P. Lockhart, President and Chief Executive Officer Federal Reserve Bank of Atlanta and it is available here.
| ICSC-UBS (SA, 1977=100) | 01/05/08 | 12/29/07 | Y/Y | 2007 | 2006 | 2005 |
|---|---|---|---|---|---|---|
| Total Weekly Chain Store Sales | 489.6 | 487.7 | 1.9% | 2.8% | 3.3% | 3.6% |
by Tom Moeller January 8, 2008
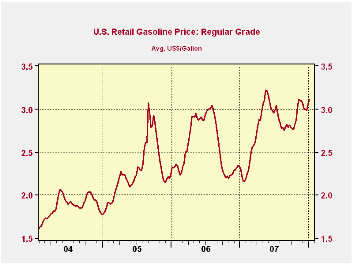
The retail price of gasoline rose a nickel last weeks to $3.11 per gallon following a seven cent rise during the prior week.
The increase returned prices to the highest level in nearly two months.During that opening week of 2008, crude oil prices jumped sharply to $98.17 for a barrel WTI crude. The increase reversed yesterday, however, with forecasts that unseasonably warm temperatures in the Northeast U.S. would continue. Crude prices fell to $95.10 per barrel.
Natural gas prices also fell yesterday, but sharp gains in December raised the wholesale price to an average $7.67 per mmbtu. Prices were up by roughly one quarter from the very warm December of 2006.
What's Driving Gasoline Prices from the Federal Reserve Bank of Dallas can be found here.
| Energy Prices | 01/07/08 | 12/31/07 | Y/Y | 2007 | 2006 | 2005 |
|---|---|---|---|---|---|---|
| Retail Gasoline ($/Gallon) | 3.11 | 3.06 | 34.8% | 2.80 | 2.57 | 2.27 |
by Robert Brusca January 8, 2008
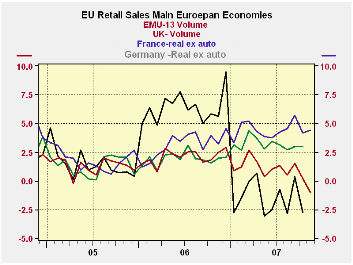
EMU retail sales volumes fell by 0.5% In November and are off
at a 4.2% annualized rate in Q4. The figures show the Euro Area as a
region that is still unsupported by consumer activity. While German
manufacturing seems to be still healthy (see today’s orders report) the
consumer in Europe is floundering. Sales volumes are lower by 1% Yr/Yr
and are falling at a 0.2% pace over six months. Over three months the
annual rate of decline is 4.3%.
Nonfood sales are lagging the most down by 0.6% in the month
compared to a -0.4% drop for food. Yr/Yr declines for the two
categories of retail sales growth are similar, around -1%. Although the
Manufacturing data for the Euro Area have softened they show more
resilience. Still with the very strong euro and a very weak consumer it
is difficult to be too upbeat on the Euro Area’s prospects.
| Ezone (13) Retail Sales Volume | ||||||
|---|---|---|---|---|---|---|
| Nov-07 | Oct-07 | Sep-07 | 3-Mo | 6-Mo | 12-Mo | |
| Zone-13 Total | -0.5% | -0.7% | 0.1% | -4.3% | -0.2% | -1.0% |
| Food | -0.4% | -0.5% | 0.2% | -2.6% | -1.0% | -0.9% |
| Non Food | -0.6% | -0.8% | 0.0% | -5.3% | 0.2% | -1.1% |
| Textiles | #N/A | -2.9% | 2.1% | -5.0% | -2.0% | 2.5% |
| HH Goods | #N/A | -0.4% | -1.3% | -4.8% | 0.1% | -0.1% |
| Books news, etc | #N/A | 0.1% | -0.5% | -2.8% | 1.1% | 1.2% |
| Pharmaceuticals | #N/A | 0.3% | 0.6% | 4.5% | 4.6% | 4.2% |
| Other Non Spec | #N/A | #N/A | 0.6% | #N/A | #N/A | #N/A |
| Mail Order | #N/A | #N/A | -0.1% | #N/A | #N/A | #N/A |
| Non-food Country Detail: Volume | ||||||
| Germany | #N/A | -3.2% | -0.1% | #N/A | #N/A | #N/A |
| France | -1.0% | 0.4% | 0.6% | 2.6% | 5.5% | 5.6% |
| Italy (Total: Value) | #N/A | 0.6% | -0.5% | -0.3% | -0.9% | -0.9% |
| UK (EU) | 0.4% | 0.2% | 0.3% | 3.4% | 6.3% | 6.4% |
| Shaded areas calculated on a one-month lag due to lagging data | ||||||
| The EA 13 countries are Austria, Belgium, Finland, France, Germany, Greece, Ireland, Italy, Luxembourg, the Netherlands, Portugal, Slovenia | ||||||
by Louise Curley January 8, 2008
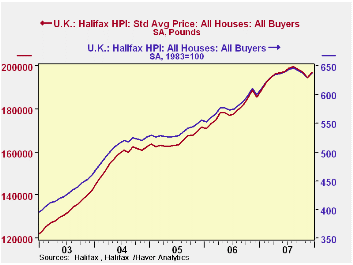
The seasonally adjusted Halifax Bank of Scotland's Index of house prices showed a slight rise in the price of houses in the United Kingdom in December after declines in the three previous months. The Index rose 1.3% from 629.5 (1983=100) November to 637.7 in December. The Bank also publishes data on the pound price of a house. In December the price rose to 197,039 pounds from 194.500 in November. The average price of all houses in the U.K. in index and pound terms is shown in the first chart.
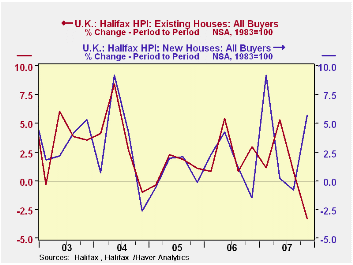
Seasonal adjustment has only been applied to the price of all houses. Prices paid for new and existing house and prices paid by first time buyers and former owner occupiers are available only on an unadjusted bases. In order to reduce some of the noise in the data we have aggregated the data from monthly to quarterly. In spite of the rise in house prices in December, the fourth quarter showed a decline of 2.4% in the unadjusted data of total sales. The prices of existing houses, however, declined 3.3% and the price of new houses rose by 5.7%, as shown in the second chart.
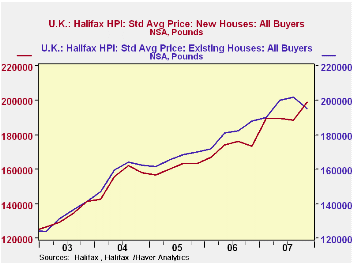
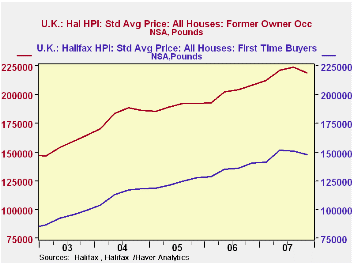
The average price paid for a new house in the last quarter of 2007 was 199 thousand pounds or almost 6% above the third quarter, while the price of an existing house was 195 thousand pounds or 3.3% below the third quarter. Prices paid for new and existing houses are shown in the third chart. Both the first time buyer and the former owner occupier paid 2% less on average for a house in the fourth quarter than in the third quarter. However the first time payer paid an average of 147 thousand pounds while a former owner occupier paid an average of 219 thousand pounds as shown in the fourth chart.
| U. K. HOUSE PRICES:HALIFAX BANK OF SCOTLAND | Dec 07 | Nov 07 | Dec 06 | M/M % Chg |
Y/Y % Chg |
2006 | 2005 | 2004 |
|---|---|---|---|---|---|---|---|---|
| Index 1983=100 | ||||||||
| All Houses SA | 637.7 | 629.5 | 599.7 | 1.30 | 6.34 | 634.3 | 580.1 | 535.0 |
| All Houses NSA | 632.2 | 628.7 | 594.4 | 0.56 | 6.36 | 634.3 | 580.1 | 535.0 |
| Existing Houses NSA | 641.0 | 635.6 | 612.5 | 0.85 | 4.65 | 648.4 | 595.6 | 548.7 |
| Newly Built NSA | 547.5 | 582.2 | 497.5 | -5.96 | 10.05 | 550.8 | 496.4 | 462.7 |
| Standard Average Price (Pounds) SA | 197039 | 194500 | 185280 | 1.31 | 6.35 | 195973 | 179233 | 165310 |
| Q4 07 | Q3 07 | Q4 06 | Q/Q %Chg |
Y/Y %Chg |
2006 | 2005 | 2004 | |
| All Houses SA | 634.7 | 643.9 | 602.8 | -1.39 | 5.33 | 634.3 | 580.1 | 535.0 |
| All Houses NSA | 633.7 | 649.3 | 601.2 | -2.40 | 5.40 | 634.3 | 580.1 | 535.0 |
| Existing Houses NSA | 643.0 | 664.9 | 619.0 | -3.30 | 3.87 | 648.4 | 595.6 | 548.7 |
| Newly Built NSA | 572.0 | 541.2 | 498.6 | 5.70 | 14.72 | 550.8 | 496.4 | 462.7 |

Tom Moeller
AuthorMore in Author Profile »Prior to joining Haver Analytics in 2000, Mr. Moeller worked as the Economist at Chancellor Capital Management from 1985 to 1999. There, he developed comprehensive economic forecasts and interpreted economic data for equity and fixed income portfolio managers. Also at Chancellor, Mr. Moeller worked as an equity analyst and was responsible for researching and rating companies in the economically sensitive automobile and housing industries for investment in Chancellor’s equity portfolio. Prior to joining Chancellor, Mr. Moeller was an Economist at Citibank from 1979 to 1984. He also analyzed pricing behavior in the metals industry for the Council on Wage and Price Stability in Washington, D.C. In 1999, Mr. Moeller received the award for most accurate forecast from the Forecasters' Club of New York. From 1990 to 1992 he was President of the New York Association for Business Economists. Mr. Moeller earned an M.B.A. in Finance from Fordham University, where he graduated in 1987. He holds a Bachelor of Arts in Economics from George Washington University.
More Economy in Brief


