 Global| Nov 13 2007
Small Business Optimism Held Low, Credit Problems Eased
by:Tom Moeller
|in:Economy in Brief
Summary
Small business optimism rose by 1.1% last month and reversed all of its September increase. Nevertheless, the level remained near the lows of this past Summer, according to the National Federation of Independent Business (NFIB). [...]
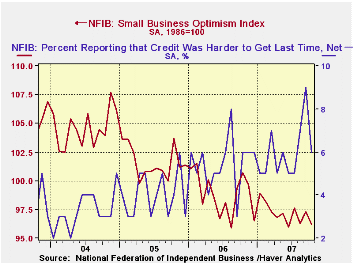
Small business optimism rose by 1.1% last month and reversed all of its September increase. Nevertheless, the level remained near the lows of this past Summer, according to the National Federation of Independent Business (NFIB).
During the last ten years there has been a 70% correlation between the level of the NFIB index and the two quarter change in real GDP.
The percentage of firms indicating that credit was more difficult to get reversed all of the September increase, though it remained in an uptrend.
Respondents expecting the economy to improve fell and remained
in the low range of the last year. During the last ten years there has
been a 72% correlation between the NFIB percentage and the y/y change
in nonfarm payrolls.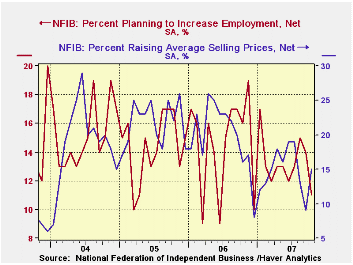
The percent planning to raise capital expenditures fell to near the lows of this cycle and the percentage planning to raise employment fell sharply m/m to the lowest level since last December.
The percentage of firms indicating that inventories were too low fell to the current cycle's low..The percentage of firms planning to raise average selling prices remained low as did the percentage of firms actually raising prices, though the latter rose m/m. During the last ten years there has been a 60% correlation between the change in the producer price index and the level of the NFIB price index.
About 24 million businesses exist in the United States. Small business creates 80% of all new jobs in America.
| Nat'l Federation of Independent Business | October | September | Y/Y | 2006 | 2005 | 2004 |
|---|---|---|---|---|---|---|
| Small Business Optimism Index (1986=100) | 96.2 | 97.3 | -4.5% | 98.9 | 101.6 | 104.6 |
by Tom Moeller November 13, 2007
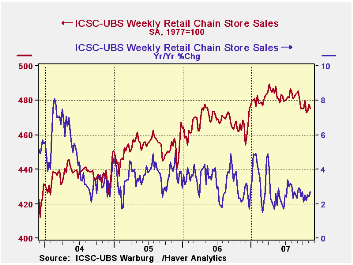
Chain store sales last week eased 0.5% and reversed half of the gain earlier in November, according to the International Council of Shopping Centers (ICSC)-UBS.
For both weeks this month, sales were up a small 0.2% from the October average which fell 0.8% from September.
During the last ten years there has been a 45% correlation between the y/y change in chain store sales and the change in nonauto retail sales less gasoline.The ICSC-UBS retail chain-store sales index is constructed using the same-store sales (stores open for one year) reported by 78 stores of seven retailers: Dayton Hudson, Federated, Kmart, May, J.C. Penney, Sears and Wal-Mart.
The leading indicator of chain store sales from ICSC-UBS rose 0.2% (-0.1% y/y) reversing a price of the prior week's rise.
The October 2007 Senior Loan Officer Opinion Survey on Bank Lending Practices from the Federal Reserve Board is available here.
| ICSC-UBS (SA, 1977=100) | 11/10/07 | 11/03/07 | Y/Y | 2006 | 2005 | 2004 |
|---|---|---|---|---|---|---|
| Total Weekly Chain Store Sales | 475.2 | 477.8 | 2.7% | 3.3% | 3.6% | 4.7% |
by Louise Curley November 13, 2007
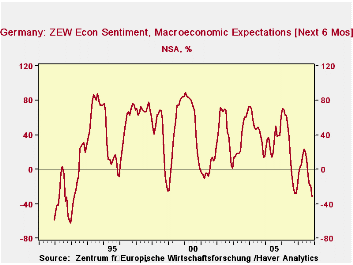
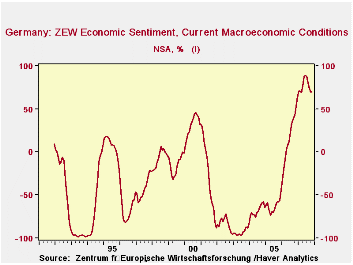
After remaining steady in October at -18.1%, the ZEW indicator of economic sentiment among institutional investors and analysts for the next 6 months took a tumble in November, falling sharply to -32.5%. The decline brought the indicator to its lowest value since February 1993. (The history of this indicator is shown in the first chart.)
The indicator is a percent balance measure, that is, it measures the difference between those participants who are optimistic and those who are pessimistic. In October, the pessimists outweighed the optimists by 32.5%. The indicator is based on the qualitative assessments of the participants regarding the macro economic outlook, the inflation rate, short and long term interest rates, the stock market and exchange rates. The decline in sentiment reflects the deterioration that has been taking place in most of these components. The continuing uncertainty regarding the magnitude and spread of the sub prime mortgage collapse in the U. S. has been a major depressant, but other factors have also contributed to the decline in sentiment. Inflation has been rising and in October was 2.45% compared with 1.65% in January. During the time that the survey took place--October 29 to November 12, the Euro rose 7.23% from $1.3596 to $1.4579. The Frankfurt Xetra Dax (12/31/87=1000) stock market index declined 2.5% during this same time. The second chart shows the year over year changes in the daily figures for the Euro and the Dax stock market index from late October to date, roughly the time during which the survey took place.
In contrast to their pessimistic views about the next six
months, investors and analysts continue to view current conditions very
favorably with the optimists outweighing the pessimists by 70%, one of
the highest balances on record. The third chart shows the history of
the indicator of current conditions.

| ZEW INDICATOR OF ECONOMIC SENTIMENT (% Balance) | Nov 07 | Oct 07 | Nov 06 | M/M Dif | Y/Y Dif | 2006 | 2005 | 2004 |
|---|---|---|---|---|---|---|---|---|
| Macro Expectation (Next 6 Months) | -32.5 | -18.1 | -28.5 | -14.4 | -4.0 | 22.3 | 34.8 | 44.6 |
| Current Economic Conditions | 70.0 | 70.2 | 53.0 | -0.2 | 17.0 | 18.3 | -61.8 | -67.7 |
by Robert Brusca November 13, 2007
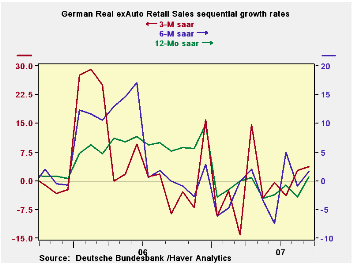
Spending patterns improved in September from August despite their downward revision. Sequential rates of growth find 3-month and 6-month rates of growth are generally improved form their respective year ago pace. Nominal auto sales were especially strong in the quarter expanding at a growth rate of better than 20%. But excluding autos consumer spending is still very restrained. For the quarter real German retail sales excluding autos are up by just a rate of 0.7%. Nominal retail sales are up at a 1.6% pace in the quarter. Nominal food and tobacco sales are off by 0.9% in the quarter. Clothing and shoe sales are up by just 2.3%. The sequential growth rates show more pop than the quarterly growth rates do. Time will tell if the rebound is authentic or not.
| German Real and Nominal Retail Sales New QTR | ||||||||
|---|---|---|---|---|---|---|---|---|
| Nominal | Sep-07 | Aug-07 | Jul-07 | 3-MO | 6-MO | 12-MO | YrAGo | New Qtr Saar |
| Retail Ex auto | 2.0% | -1.1% | 0.6% | 6.3% | 3.7% | 1.9% | 5.6% | 1.6% |
| MV and Parts | -2.4% | 4.3% | 0.8% | 10.7% | 12.8% | -2.5% | 15.2% | 21.8% |
| Food Beverages & Tobacco | 2.9% | -0.8% | -0.2% | 7.7% | 4.4% | 1.7% | 5.1% | -0.9% |
| Clothing footwear | 3.8% | 0.3% | 0.2% | 18.3% | 8.2% | 14.5% | 3.4% | 2.3% |
| Real | ||||||||
| Retail Ex auto | 1.6% | -1.5% | 0.8% | 3.7% | 1.7% | 0.7% | 5.1% | 0.7% |
by Robert Brusca November 13, 2007
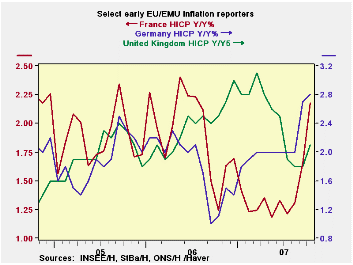
In October, as energy prices have surged again, the Euro area is suffering inflation bulging beyond the limits of its ceiling. We know that the ECB is not happy with this development even though most of it is due to oil prices and core inflation seems less of a problem. Still the ECB makes policy without an explicit reference to core prices unlike the Federal Reserve in the US.
Despite a surging Euro that should help to combat any true inflation forces in the Euro area economy, the ECB remains wary of this over top inflation partly because of the ongoing strong money and credit growth in the EMU. So Europeans find themselves in the sticky position of seeing inflation flare, the central bank remain wary, ready to act, even as their currency value remains quite strong and the competitiveness pressures from that strength are squelching growth and killing Europe’s export orders. The European policy dilemma has become an economic oxymoron: the ECB’s own threat to hike rates is further bolstering the euro and further exacerbating the economic problems within the zone as the ECB does nothing and worries about inflation pressure which worsen.
| Euro area & Friends: Headline Inflation Yr/Yr | |||||||
|---|---|---|---|---|---|---|---|
| Year/year | Mo/Mo | 3Mo: AR | 6Mo:Ar | ||||
| Core HICP | Oct-07 | Sep-07 | Aug-07 | Oct-07 | Sep-07 | May-07 | Apr-07 |
| Belgium | 2.2% | 1.5% | 1.2% | 0.8% | 0.1% | 3.5% | 2.1% |
| France | 2.1% | 1.6% | 1.3% | 0.2% | 0.1% | 2.6% | 2.3% |
| Germany | 2.7% | 2.6% | 2.0% | 0.2% | 0.7% | 3.1% | 2.7% |
| Greece | 3.1% | 2.9% | 2.7% | 0.4% | 0.3% | 1.1% | 4.0% |
| Ireland | 3.0% | 2.9% | 2.3% | 0.2% | 0.3% | 2.3% | 2.5% |
| Italy | 2.3% | 1.8% | 1.7% | 0.7% | 0.3% | 4.7% | 3.3% |
| Luxembourg | 3.6% | 2.5% | 1.8% | 0.6% | 0.0% | 2.8% | 2.7% |
| The Netherlands | 1.6% | 1.3% | 1.0% | 0.4% | 0.0% | 1.5% | 0.6% |
| EU: Other HICP/CPI | |||||||
| UK(HICP) | 2.0% | 1.7% | 1.8% | 0.5% | 0.1% | 2.7% | 1.5% |

Tom Moeller
AuthorMore in Author Profile »Prior to joining Haver Analytics in 2000, Mr. Moeller worked as the Economist at Chancellor Capital Management from 1985 to 1999. There, he developed comprehensive economic forecasts and interpreted economic data for equity and fixed income portfolio managers. Also at Chancellor, Mr. Moeller worked as an equity analyst and was responsible for researching and rating companies in the economically sensitive automobile and housing industries for investment in Chancellor’s equity portfolio. Prior to joining Chancellor, Mr. Moeller was an Economist at Citibank from 1979 to 1984. He also analyzed pricing behavior in the metals industry for the Council on Wage and Price Stability in Washington, D.C. In 1999, Mr. Moeller received the award for most accurate forecast from the Forecasters' Club of New York. From 1990 to 1992 he was President of the New York Association for Business Economists. Mr. Moeller earned an M.B.A. in Finance from Fordham University, where he graduated in 1987. He holds a Bachelor of Arts in Economics from George Washington University.
More Economy in Brief


