 Global| Oct 27 2008
September U.S. New-Home Sales Ticked Up but Still Near the Cycle's Low
by:Tom Moeller
|in:Economy in Brief
Summary
The U.S. Census Department reported that September sales of new single-family homes ticked up 2.7% m/m to 464,000. The rise followed a 12.6% m/m decline during August that was little revised. The level of sales in September was down [...]
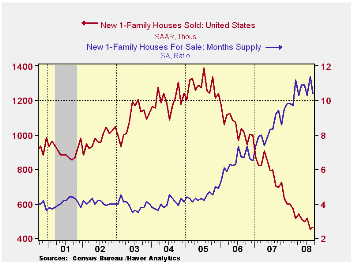
The U.S. Census Department reported that September sales of new single-family homes ticked up 2.7% m/m to 464,000. The rise followed a 12.6% m/m decline during August that was little revised. The level of sales in September was down 66.6% from the July 2005 peak but it was slightly better than Consensus expectations for 450,000 sales.
By region sales in the West accounted for most of last month's increase in the total with a 22.7% gain. However, the rise did not wholly make up a 30.2% slide during August. In the South sales ticked up 0.7% but that hardly dented a 5.7% August drop. Reflecting the weakness in the auto industry, new home sales in the Midwest sales reversed all of their August rise with a 5.6% slide. Suffering greatly from weakness in the financial industry, new home sales in the Northeast dropped 21.4% m/m after an August slide of 34.9%. September sales in the Northeast were roughly 80% below the peaks in 2004-05.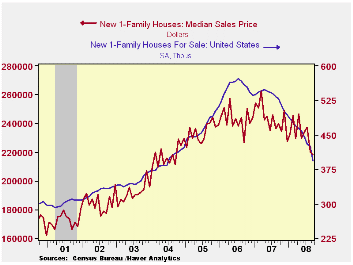
The median price for a new single-family home declined a slight 0.9% to $218,400. However, that slip followed a sharp 7.1% m/m drop in August and prices were off 9.1% y/y. New home prices in September were back to where they were late in 2004. The decline in home prices roughly matched the drop reported last week by the Office of Federal Housing Enterprise Oversight (FHFA). The FHFA figures, (formerly the Office of Federal Housing Enterprise Oversight (OFHEO), as well as the Census Dept. figures, are available in Haver's USECON database.
The number of new homes for purchase again fell sharply, by 7.3% (-25.4% y/y). That reduced the inventory of unsold homes to the lowest level since late-2004. In each of the country's regions the inventory is down roughly one-quarter during the last year.
The month's supply of new homes for sale ticked lower m/m to 10.4, not far from the peak of 11.4 months during August.
Foreclosure prevention efforts and market stability is last week's Senate testimony given by Fed Governor Elizabeth A. Duke and it can be found here.
| US New Homes | September | August | Y/Y (%) | 2007 | 2006 | 2005 |
|---|---|---|---|---|---|---|
| Total Sales (SAAR, 000s) | 464 | 452 | -33.1 | 768 | 1,049 | 1,279 |
| Northeast | 22 | 28 | -65.1 | 64 | 64 | 81 |
| Midwest | 65 | 69 | -37.5 | 118 | 161 | 203 |
| South | 269 | 267 | -23.8 | 408 | 559 | 638 |
| West | 108 | 88 | -37.9 | 178 | 266 | 356 |
| Median Price (NSA, $) | 218,400 | 220,400 | -9.1 | 243,742 | 243,067 | 234,208 |

Tom Moeller
AuthorMore in Author Profile »Prior to joining Haver Analytics in 2000, Mr. Moeller worked as the Economist at Chancellor Capital Management from 1985 to 1999. There, he developed comprehensive economic forecasts and interpreted economic data for equity and fixed income portfolio managers. Also at Chancellor, Mr. Moeller worked as an equity analyst and was responsible for researching and rating companies in the economically sensitive automobile and housing industries for investment in Chancellor’s equity portfolio. Prior to joining Chancellor, Mr. Moeller was an Economist at Citibank from 1979 to 1984. He also analyzed pricing behavior in the metals industry for the Council on Wage and Price Stability in Washington, D.C. In 1999, Mr. Moeller received the award for most accurate forecast from the Forecasters' Club of New York. From 1990 to 1992 he was President of the New York Association for Business Economists. Mr. Moeller earned an M.B.A. in Finance from Fordham University, where he graduated in 1987. He holds a Bachelor of Arts in Economics from George Washington University.
More Economy in Brief


