 Global| Sep 15 2009
Sales Trim Losses As Inventories Are Looking Lean
Summary
Inventories fell again in the current month. Still the 1% drop while large is the smallest drop in eight months. Inventories average a 1.3% monthly decline in Q2 so in Q4 inventories are improving by 30% over the previous quarter. The [...]
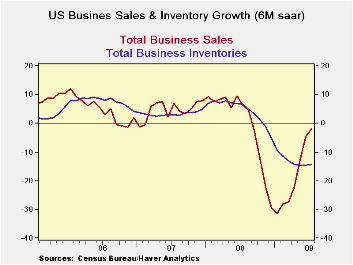
Inventories fell again in the current month. Still the 1% drop
while large is the smallest drop in eight months. Inventories average a
1.3% monthly decline in Q2 so in Q4 inventories are improving by 30%
over the previous quarter.
The inventory conundrum - For the impact
on GDP, it is not the change in inventory levels that matters but the
change in the change. If inventories fall by the same amount in each
month of Q2 and in Q3 the change in inventory investment will be zero
(the same amount of investment in each quarter). The fact that
inventories are falling by less in Q3 is the key to seeing there is a
boost in GDP in the offing even though inventories are still falling.
Right now the average drop per month in Q3 is $13bln compared to a drop
of $18bln in Q2. Annualize that difference and you get a large swing.
Still you still have to inflation-adjust those numbers and remember, it
is only one month in the new quarter. But you get the picture.
Inventories are a positive factor already.
I to S ratio is LOW - In the table above we
show the percentile standing of the I-to-S ratio in its three-year
range. For retailers it is the lowest inventory-to-sales ratio in three
years. Wholesalers have inventories at a mid range mark, while for
manufacturers inventories are still in the top 22% of their three year
range (78th percentile) relative to sales.
Sequential growth trend is your friend--
The sequential growth rates show that the pace of sales has moved from
the negative to the positive from 12-months to six-months to 3-months
across manufacturers, retailers and wholesalers. This is good news. The
pace of inventory declines for the most part seems to have plateaued as
three month growth rates are even with six month growth rates for the
major business sectors.
The end of days…the dog days -- Despite the fact that inventories are still declining you cans see the whites of the business expansion’s eyes. The end of recession is at hand; the start of recovery is in play. Sales are on an upswing across sectors the I-to-S ratios are mostly low and the pace of the inventory decline is flattening out. These facts should make inventories a positive factor for growth in Q3 and could make them a powerful factor for Q4 growth as well. Remember that inventories are still falling and the rebuilding process has not yet begun, so this switch powered eventually by inventory growth, not just slower paring, could go on for some time.
| 2009.Jul | Inventory and Sales Paired Growth Rates by Major Divisions | ||||||||
|---|---|---|---|---|---|---|---|---|---|
| 3-Mo Growth |
6-Mo Growth |
12-Mo Growth |
YrAgo Growth |
I:S ratio |
|||||
| Sales | Inventory | Sales | Inventory | Sales | Inventory | Sales | Inventory | %-tile | |
| Total Business | 4.7% | -13.6% | -1.9% | -14.2% | -17.8% | -11.8% | 7.9% | 6.7% | 52.4% |
| Manufacturers | 3.8% | -10.0% | -3.6% | -11.8% | -22.2% | -10.0% | 7.1% | 7.8% | 78.6% |
| Retailers | 5.5% | -14.6% | 0.2% | -13.9% | -9.5% | -12.9% | 1.5% | 2.2% | 0.0% |
| Wholesalers | 5.0% | -17.0% | -2.0% | -17.4% | -19.8% | -12.8% | 15.2% | 11.0% | 52.2% |
| Ratio of STOCKS to Sales; Stocks Vs Flows | |||||||||
| Inventory-to-Sales Ratios In Perspective | Over three Years | ||||||||
| 2009.Jul | Current | 3Mo Ago |
6Mo Ago |
Yr Ago |
2Yrs Ago |
3Yrs Ago |
%-tile | Max | Min |
| Total Business | 1.36 | 1.43 | 1.46 | 1.27 | 1.28 | 1.28 | 52.4% | 1.46 | 1.25 |
| Manufacturers | 1.40 | 1.45 | 1.46 | 1.21 | 1.20 | 1.19 | 78.6% | 1.46 | 1.18 |
| Retailers | 1.45 | 1.53 | 1.57 | 1.51 | 1.50 | 1.50 | 0.0% | 1.62 | 1.45 |
| Wholesalers | 1.23 | 1.31 | 1.34 | 1.13 | 1.17 | 1.17 | 52.2% | 1.34 | 1.11 |

Robert Brusca
AuthorMore in Author Profile »Robert A. Brusca is Chief Economist of Fact and Opinion Economics, a consulting firm he founded in Manhattan. He has been an economist on Wall Street for over 25 years. He has visited central banking and large institutional clients in over 30 countries in his career as an economist. Mr. Brusca was a Divisional Research Chief at the Federal Reserve Bank of NY (Chief of the International Financial markets Division), a Fed Watcher at Irving Trust and Chief Economist at Nikko Securities International. He is widely quoted and appears in various media. Mr. Brusca holds an MA and Ph.D. in economics from Michigan State University and a BA in Economics from the University of Michigan. His research pursues his strong interests in non aligned policy economics as well as international economics. FAO Economics’ research targets investors to assist them in making better investment decisions in stocks, bonds and in a variety of international assets. The company does not manage money and has no conflicts in giving economic advice.
More Economy in Brief


