 Global| Dec 23 2005
Rise in U.S. Durable Goods Orders All Air(craft)
by:Tom Moeller
|in:Economy in Brief
Summary
Orders for nondefense aircraft more than doubled m/m last month (158.6% y/y) and combined with a 51.6% surge in October to lift durable goods orders 4.4% versus Consensus expectations for a 1.0% November rise. Less the volatile [...]

Orders for nondefense aircraft more than doubled m/m last month (158.6% y/y) and combined with a 51.6% surge in October to lift durable goods orders 4.4% versus Consensus expectations for a 1.0% November rise.
Less the volatile transportation sector, durable goods orders fell 0.6% for the third consecutive monthly decline.
Declines in orders last month were widespread across industries. Machinery orders, which had been strong, fell 1.6% (+12.7% y/y). Orders for communications equipment also fell 4.4% (+8.6% y/y) as did orders for motor vehicles & parts which fell 5.7% (-2.1% y/y). Finally, fabricated metals orders fell 2.4% (+1.4%), down for the second consecutive month.
To the upside, orders for computers & related products rose 5.3% (11.6% y/y) and primary metals orders increased 1.4% (11.4% y/y).
Orders for nondefense capital goods rose 19.6% due to the surge in aircraft orders which continued to benefit from the end of the Boeing strike in September. Less aircraft, nondefense capital goods orders fell 2.0% and have been erratically moving sideways since the Spring.
Shipments of durable goods fell 0.2% (6.3% y/y) in November following a 1.2% October increase. Less the transportation sector, shipments fell slightly (6.7% y/y) after a 1.0% October jump.
Order backlogs jumped 3.1% (13.9% y/y), again reflecting the rebound in aircraft. Less transportation backlogs rose a more moderate 0.7% (9.6% y/y) but the ratio of backlogs to shipments outside of transportation rose to its highest level since early 2002.
Durable inventories rose 0.5% (4.1% y/y) after a like gain October. The I/S ratio for durable goods increased modestly m/m but remained below the highs of earlier this year.
| NAICS Classification | Nov | Oct | Y/Y | 2004 | 2003 | 2002 |
|---|---|---|---|---|---|---|
| Durable Goods Orders | 4.4% | 3.0% | 12.1% | 9.5% | 4.1% | -3.4% |
| Excluding Transportation | -0.6% | -0.2% | 7.1% | 11.7% | 3.1% | -6.2% |
| Nondefense Capital Goods | 19.6% | 6.7% | 31.4% | 11.0% | 4.2% | -9.8% |
| Excluding Aircraft | -2.0% | 1.2% | 7.5% | 9.5% | 4.8% | -10.5% |
by Tom Moeller December 23, 2005

Consumer sentiment late in December added to gains earlier in the month, reported the University of Michigan. At 91.5 for the month as a whole, sentiment rose 12.1% from November which had risen 10.0% from October and beat Consensus expectations for an increase to 89.0.
During the last ten years there has been a 76% correlation between the level of consumer sentiment and the y/y change in real consumer spending.
Consumers' expectations rose 15.2% on top of a 10.1% November gain to the highest level since July. Expected business conditions during the next year surged again and the index has improved more than two thirds since September. Expectations for personal finances also jumped. Adding to a small improvement the gains halted declines during the Summer.
The mean expected inflation rate for the next twelve months held steady m/m at 4.1% and was below the 5.5% expected in October & September.
The current conditions index rose 8.9% following a similar gain in November. The reading of personal finances surged 15.5% (6.3% y/y) and the reading of buying conditions for large household goods jumped for the second straight month (-0.6% y/y).Decline's in consumers' reading of gov't economic policy (-20.0% y/y) have stabilized during the last two months.
The University of Michigan survey is not seasonally adjusted.The mid-month survey is based on telephone interviews with 250 households nationwide on personal finances and business and buying conditions. The survey is expanded to a total of 500 interviews at month end.
| University of Michigan | Dec | Dec (Prelim.) | Nov | Y/Y | 2004 | 2003 | 2002 |
|---|---|---|---|---|---|---|---|
| Consumer Sentiment | 91.5 | 88.7 | 81.6 | -5.8% | 95.2 | 87.6 | 89.6 |
| Current Conditions | 109.1 | 106.6 | 100.2 | 2.2% | 105.6 | 97.2 | 97.5 |
| Expectations | 80.2 | 77.3 | 69.6 | -11.8% | 88.5 | 81.4 | 84.6 |
by Tom Moeller December 23, 2005

New single-family home sales in November fell 11.3% to 1.245M and reversed more than all of the prior month's downwardly revised 11.4% increase. Consensus expectations had been for a more moderate decline to 1.31M.
Sales fell across the nation except in the Northeast where a 13.4% (9.4% y/y) gain added to the 41.4% rise in October. In the West sales fell 22.1% (+0.6% y/y) and reversed most of the prior month's increase while sales in the South also reversed the prior month's gain and fell 5.5% (+10.1% y/y). In the Midwest, sales fell hard for the fifth month in the last six and are down 35.3% since the May peak.
The median price of a new single family home fell for the third straight month. The 4.1% m/m decline (0.3% y/y) to $225,200 left the price about even with last November following appreciation of 17.1% from the end of 2003 to the end of 2004.
The figures from the Census Department reflect home sales counted at the time of sales contract or deposit.
| Homes Sales (000s, AR) | Nov | Oct | Y/Y | 2004 | 2003 | 2002 |
|---|---|---|---|---|---|---|
| New Single-Family | 1,245 | 1,404 | 6.0% | 1,200 | 1,091 | 976 |
by Carol Stone December 23, 2005
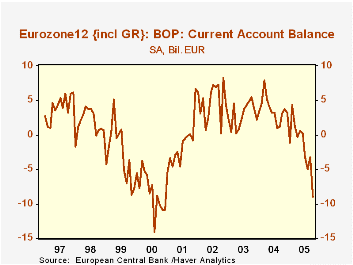
The European Central Bank today reported that the Euro-Zone12 countries had an aggregate current account deficit of €9 billion in October, the largest monthly deficit since December 2000. Adverse movements in both credit and debit flows were responsible for the sizable deterioration from -€3.3 billion in September and a surplus of €3.1 billion in the year-earlier month. (All data here are seasonally adjusted.)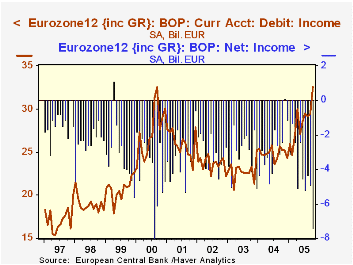
In the month, goods exports fell €2.8 billion, so token increases in credit flows in other parts of the current account were not able to offset completely that decline and total credits to the current account eased by €1.0 billion. Debit items, however, rose once again, this month by €4.8 billion, with a total increase of €22.6 billion in the last year. It's easy to say, oh well, higher priced petroleum must have done that. It was important, but total goods imports accounted for only about 60% of the deterioration. Outflows of investment income were the other major negative, increasing €3.2 billion from September to €32.6 billion, tied for a record high with September 2000. Growth in foreign investments into the Euro-Zone countries over the last five years, particularly for portfolio investment, have apparently generated the rising outflow of interest and dividends. All together, the balance on goods, usually in comfortable surplus for the Euro-Zone as a whole, diminished to just barely positive in October, €300 million. Net investment income was -€7.4 billion, the second largest such shortfall since these accounts began in 1997; only August 2000 was larger, with €8.0 billion.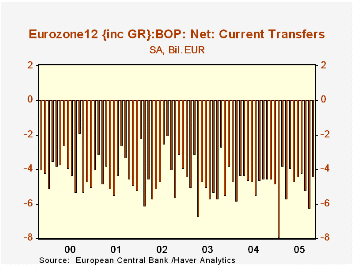
One bittersweet note on these data at this holiday season. Net current transfers in October were -€4.4 billion, less negative than September's €6.2 billion and similar to their recent range between €4 and €5 billion. However, in January 2005, this balance was -€7.9 billion, by far the largest ever, with €14.8 billion in debit outflows, also considerably larger than any other month. We'd surmise that at least some of the extra funds in that month represented European governments' and residents' contributions to Asian tsunami relief, widely recognized as an extraordinary disaster fund-raising effort. See the third graph for an illustration.
| Euro-Zone12Bil.€, Seasonally Adjusted | Oct 2005 | Sept 2005 | Oct 2004 | Monthly Averages|||
|---|---|---|---|---|---|---|
| 2004 | 2003 | 2002 | ||||
| Current Account Balance | -9.0 | -3.3 | 3.1 | 3.6 | 2.9 | 4.9 |
| Credit | 166.8 | 167.8 | 156.3 | 152.5 | 141.2 | 144.0 |
| Debit | 175.8 | 171.1 | 153.2 | 148.8 | 138.3 | 139.2 |
| Goods Balance | 0.3 | 5.3 | 6.6 | 8.8 | 9.1 | 10.9 |
| Services Balance | 2.5 | 2.5 | 3.4 | 2.4 | 1.6 | 1.1 |
| Income Balance | -7.4 | -4.9 | -2.4 | -2.8 | -3.1 | -3.1 |
| Net Transfers | -4.4 | -6.2 | -4.5 | -4.7 | -4.8 | -4.1 |

Tom Moeller
AuthorMore in Author Profile »Prior to joining Haver Analytics in 2000, Mr. Moeller worked as the Economist at Chancellor Capital Management from 1985 to 1999. There, he developed comprehensive economic forecasts and interpreted economic data for equity and fixed income portfolio managers. Also at Chancellor, Mr. Moeller worked as an equity analyst and was responsible for researching and rating companies in the economically sensitive automobile and housing industries for investment in Chancellor’s equity portfolio. Prior to joining Chancellor, Mr. Moeller was an Economist at Citibank from 1979 to 1984. He also analyzed pricing behavior in the metals industry for the Council on Wage and Price Stability in Washington, D.C. In 1999, Mr. Moeller received the award for most accurate forecast from the Forecasters' Club of New York. From 1990 to 1992 he was President of the New York Association for Business Economists. Mr. Moeller earned an M.B.A. in Finance from Fordham University, where he graduated in 1987. He holds a Bachelor of Arts in Economics from George Washington University.
More Economy in Brief


