 Global| Dec 29 2009
Retail Trade: Predictor Of Change In Total GDP?
Summary
Reports of retail trade in Spain, Sweden and Hong Kong were among today's statistical releases. Retail sales are sometimes good indicators of trends in total GDP. In order to test this hypothesis, we computed the correlation [...]
 Reports of
retail trade in Spain, Sweden and Hong Kong were among today's
statistical releases. Retail sales are sometimes good
indicators of trends in total GDP. In order to test this
hypothesis, we computed the correlation coefficients between the year
over year percent change in the quarterly values of the value index of
retail sales and the year over year percent change in the value of
total GDP over the past ten years*. The first three charts
show these correlations.
Reports of
retail trade in Spain, Sweden and Hong Kong were among today's
statistical releases. Retail sales are sometimes good
indicators of trends in total GDP. In order to test this
hypothesis, we computed the correlation coefficients between the year
over year percent change in the quarterly values of the value index of
retail sales and the year over year percent change in the value of
total GDP over the past ten years*. The first three charts
show these correlations.
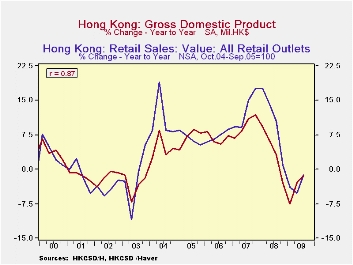
The highest correlation was in Spain where
the correlation coefficient was .94. Hong Kong was next at
.87 and Sweden was the lowest at .64. The correlation
coefficient squared, R2, is a measure of the
explanatory power of one variable on the other when all other factors
are held constant. 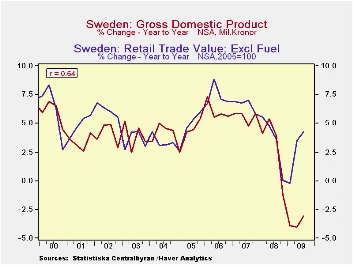 Thus, in the case of Spain, based on the
experience of the last ten years, the year to year change in retail
sales explains about 88.4% of the variation in total GDP when all other
factors are held constant. In the case of Hong Kong, the year
to year change retail sales explains 75.7% of the change in total GDP
and in the case of Sweden, only 41%. The precise values are less
important than the order of magnitude. Thus, we should expect
the trend in retail sales in Spain to have a greater impact on the
trend in total GDP than that in Hong Kong or Sweden.
Thus, in the case of Spain, based on the
experience of the last ten years, the year to year change in retail
sales explains about 88.4% of the variation in total GDP when all other
factors are held constant. In the case of Hong Kong, the year
to year change retail sales explains 75.7% of the change in total GDP
and in the case of Sweden, only 41%. The precise values are less
important than the order of magnitude. Thus, we should expect
the trend in retail sales in Spain to have a greater impact on the
trend in total GDP than that in Hong Kong or Sweden.
The fourth chart
shows the year over year changes in monthly retail sales in the three
countries.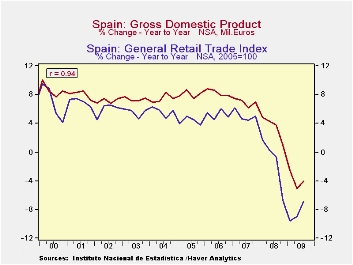 On the basis of the past relationship between
retail sales and total GDP the year to year changes in the value of
retail sales in October and November of 9.9% and 11.7% for Hong Kong
suggest there is a good chance that the year to year change in the
fourth quarter total GDP will increase from -1.99% in the third quarter
to perhaps a positive value. The continued negative, though
diminishing, yearly comparisons of retail sales in Spain suggest that
any improvements in year to year comparison for total GDP in the fourth
quarter is likely to be small.
On the basis of the past relationship between
retail sales and total GDP the year to year changes in the value of
retail sales in October and November of 9.9% and 11.7% for Hong Kong
suggest there is a good chance that the year to year change in the
fourth quarter total GDP will increase from -1.99% in the third quarter
to perhaps a positive value. The continued negative, though
diminishing, yearly comparisons of retail sales in Spain suggest that
any improvements in year to year comparison for total GDP in the fourth
quarter is likely to be small.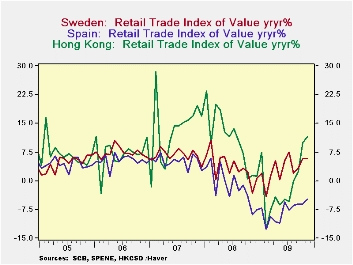 For Sweden, the year to year
increases in retail sales of 5.8% and 5.7% in October and November may
be large enough to have a positive effect on the increase in total GDP
in spite of the fact that the yearly change in retail sales has less
than a major effect on the change in total GDP. *(Computation of the
correlation coefficient can be done in DLXVG3 by clicking on
"Correlation" in the TOOLS menu.)
For Sweden, the year to year
increases in retail sales of 5.8% and 5.7% in October and November may
be large enough to have a positive effect on the increase in total GDP
in spite of the fact that the yearly change in retail sales has less
than a major effect on the change in total GDP. *(Computation of the
correlation coefficient can be done in DLXVG3 by clicking on
"Correlation" in the TOOLS menu.)
| Retail Sales, Value Indexes Y/Y % Change | Nov 09 | Oct 09 | Sep 09 | Aug 09 | Jul 09 | Jun 09 | May 09 | Apr 09 | Mar 09 |
|---|---|---|---|---|---|---|---|---|---|
| Sweden | 5.74 | 5.80 | 3.38 | 1.80 | 7.51 | 5.16 | 0.32 | 5.21 | 1.26 |
| Spain | -4.99 | -6.03 | -6.08 | -6.51 | -7.75 | -5.54 | -10.91 | -10.57 | -9.30 |
| Hong Kong | 11.66 | 9.87 | 2.57 | -0.07 | -5.29 | -4.71 | -6.20 | -4.30 | -7.76 |


