 Global| Jun 22 2006
Refinery Gasoline Production Reaches Record in New Seasonally Adjusted Weekly Data
Summary
Total production of petroleum products has surged in the last several weeks, and refineries are operating at their highest capacity since before last September's hurricanes. These statements are based on weekly petroleum supply [...]
Total production of petroleum products has surged in the last several weeks, and refineries are operating at their highest capacity since before last September's hurricanes. These statements are based on weekly petroleum supply statistics provided by the Energy Information Administration of the Department of Energy; just in the last month, Haver Analytics has begun to seasonally adjust these data, using the same software routine used by the Fed for the money supply and other weekly data. The raw figures are contained in the OILWKLY and WEEKLY databases, and the seasonally adjusted data are in WEEKLY. 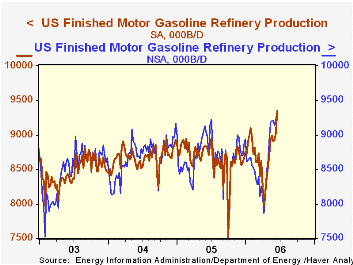
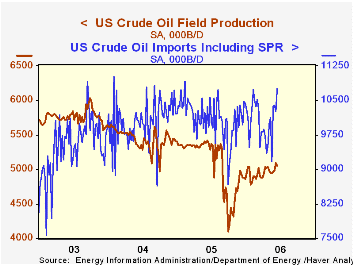
Domestic crude oil production continues its long downtrend. It was 5.05 million barrels/day (mil B/D) last week, compared with 5.10 mil B/D the week before and 5.38 mil B/D in the comparable 2005 week. So far during 2006, it has averaged 4.95 mil B/D, off 10% from 5.41 mil B/D in 2004. Domestic oil, of course, isn't nearly enough to meet today's energy needs in the US, and crude oil imports ran to 10.7 mil B/D last week, up almost exactly 8.0% from a year earlier. 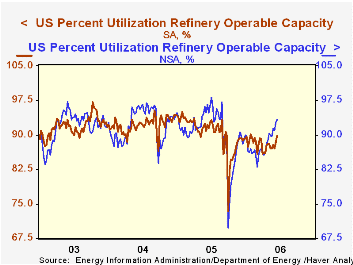
US refiners are producing more gasoline than ever, 9.34 mil B/D in the June 16 week, up 3.5% just in one week. The seasonal adjustment process is especially helpful here in smoothing the late winter/early spring slowdown due to refinery maintenance and then adjusting out the consequent rebound. This highlights the import of the latest week's jump: it's not due to some standard late-spring advance in gasoline output. Underlying gains in refinery output are also more evident in the refinery capacity utilization data, which also benefit from the seasonal adjustment. Last week's seasonally adjusted usage rate was 89.85%, which, except for one week in January, is the highest since late September 2005, just before Hurricane Rita.So gradually refiners are getting their capacity back on-stream. A hopeful note for limiting capacity pressures on product prices is that there are still a couple of percentage points of slack compared to pre-2005 levels, which were running between 91% and 92%.
| Thous B/D, Seasonally Adjusted* |
June 16, 2006 | June 9, 2006 | May 19, 2006 | June 17, 2005 | 2005 | 2004 | 2003 |
|---|---|---|---|---|---|---|---|
| Domestic Crude Oil Production | 5,052 | 5,095 | 4,937 | 5,380 | 4,861 | 5,410 | 5,640 |
| Crude Oil Imports | 10,749 | 10,267 | 9,166 | 9,929 | 10,111 | 10,044 | 9,511 |
| Refinery Gasoline Production | 9,343 | 9,028 | 8,991 | 8,707 | 8,662 | 8,681 | 8,471 |
| Refinery Capacity Utilization (%) | 89.85 | 88.45 | 87.05 | 91.49 | 90.29 | 82.24 | 91.83 |
Carol Stone, CBE
AuthorMore in Author Profile »Carol Stone, CBE came to Haver Analytics in 2003 following more than 35 years as a financial market economist at major Wall Street financial institutions, most especially Merrill Lynch and Nomura Securities. She had broad experience in analysis and forecasting of flow-of-funds accounts, the federal budget and Federal Reserve operations. At Nomura Securities, among other duties, she developed various indicator forecasting tools and edited a daily global publication produced in London and New York for readers in Tokyo. At Haver Analytics, Carol was a member of the Research Department, aiding database managers with research and documentation efforts, as well as posting commentary on select economic reports. In addition, she conducted Ways-of-the-World, a blog on economic issues for an Episcopal-Church-affiliated website, The Geranium Farm. During her career, Carol served as an officer of the Money Marketeers and the Downtown Economists Club. She had a PhD from NYU's Stern School of Business. She lived in Brooklyn, New York, and had a weekend home on Long Island.
More Economy in Brief


