Global| Jun 13 2007
Quite Simply the Retail Data and Trends Tell the Story
Summary
There was a minor upward revision to sales in March. Now in May sales rose by 1.4% and 1.3% excluding motor vehicles. These are strong numbers even when the 3.8% rise in gas station sales is factored out. Virtually all major retail [...]
There was a minor upward revision to sales in March. Now in May sales rose by 1.4% and 1.3% excluding motor vehicles. These are strong numbers even when the 3.8% rise in gas station sales is factored out. Virtually all major retail sales aggregates are gaining momentum after a Q1 lull beset with odd holiday shifts and some unfortunate weather developments.
In the quarter to date total retail sales are rising at a 7.3% pace. Excluding Motor vehicles, sales are up at a 7.9% pace. Excluding motor vehicle sales and gas station sales the pace is at 5.3% and that number will have a very small price deflator associated with it since much of the energy is removed when gas station sales are taken out.
On balance retail sales are NOW strong in the new quarter. Inflation is moderate, so much of this translates into real sales. The overall CPI rose by 0.4% in April when the core rose by 0.2%. Deflating the headline sales pace by 2.5% (annual rate) leaves growth in the range of 4.8% to 5.3% in real terms. It is a good start to Q2 for the consumer - better than was expected. If we take inflation at April’s 0.4% headline pace as the deflator, the annualized overall pace of real retail sales drops to the 2.5% to 2.9% range in Q2 - that is s till very solid and likely an overreaction to inflation’s impact.
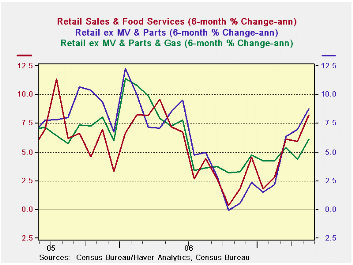 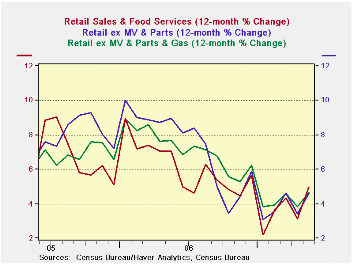 |
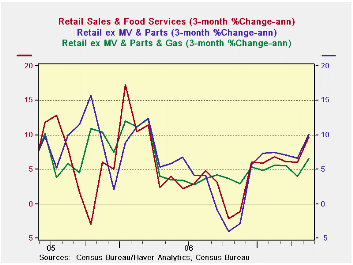
· The growth numbers cut by various retailing segments are universally strong in May and in the three months ended in May. Nondurable goods growth rates, already strong, are accelerating and that is even if gasoline station sales with their energy impact are omitted. Durable goods purchases are strengthening too. Even building materials trends are accelerating. Furniture and electronics sales are a relative laggard in the sector. But the message is pretty clear. The upturn in consumer spending is very, very broad-based in May. And comparisons with 6-month and 12-month trends (see the second and third charts) make it clear that this is not a recoup from a weak patch in earlier months. The strength is real. |
|---|
| Retail: | Mo/Mo | Seasonally Adjusted Annual Rate | |||
| Totals | 2007 May | 3-Mo | 6Mo | Yr/Yr | Yr Ago:Y/Y |
| Retail & Food Service | 1.4% | 9.6% | 8.2% | 5.0% | 7.1% |
| Retail Excl Motor Vehicles & Parts | 1.3% | 10.1% | 8.8% | 4.6% | 9.0% |
| Retail Excl Motor Vehicles & Parts & Gas | 1.0% | 6.6% | 6.1% | 4.7% | 7.7% |
| Retail: | Mo/Mo | Seasonally Adjusted Annual Rate | |||
| Durables | 2007 May | 3-Mo | 6Mo | Yr/Yr | Yr Ago:Y/Y |
| Total-Durables | 1.7% | 6.7% | 5.1% | 4.1% | 3.9% |
| Building Materials | 2.1% | 6.6% | 3.5% | -1.7% | 10.8% |
| Motor Vehicles & Parts | 1.8% | 7.9% | 6.2% | 6.6% | 0.4% |
| MV Dealers | 1.9% | 7.6% | 6.1% | 6.8% | 0.1% |
| Furniture, Electronics | 0.8% | 2.1% | 2.9% | 3.8% | 8.1% |
| Retail: | Mo/Mo | Seasonally Adjusted Annual Rate | |||
| NonDurables | 2007 May | 3-Mo | 6Mo | Yr/Yr | Yr Ago:Y/Y |
| Total-Nondurables | 1.3% | 11.2% | 9.9% | 5.4% | 8.8% |
| Food & Beverages | 0.3% | 5.7% | 6.6% | 6.1% | 4.7% |
| Health | 0.8% | 8.0% | 5.2% | 6.9% | 7.2% |
| Gasoline | 3.8% | 40.6% | 31.4% | 3.7% | 19.0% |
| Clothing | 2.7% | 13.4% | 11.0% | 7.8% | 6.1% |
| Sport Goods | 1.8% | 15.1% | 8.4% | 2.5% | 5.6% |
| General Merchandises | 1.0% | 5.7% | 5.5% | 4.6% | 5.7% |
| Non Store Retailers | 0.1% | 0.0% | 11.2% | 7.7% | 15.0% |
| Miscellaneous Retail | 0.9% | 8.0% | 5.2% | 6.9% | 7.2% |
| Non Durables Excl Gas | 0.8% | 7.0% | 6.8% | 5.7% | 7.2% |
| Services | |||||
| Food Services & Drinking | 0.7% | 9.2% | 5.7% | 5.6% | 8.1% |
by Robert Brusca June 13, 2007
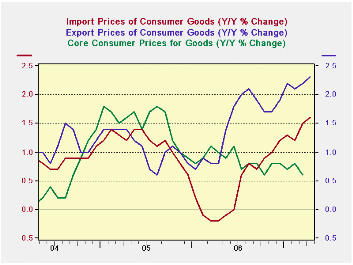
Even for the consumer where excluding food and energy trends have been mild and are not accelerating much of the acceleration in international prices is still there and quite clear. The chart on the left applies consumer price weights from nonfood consumer goods spending and applies them to export and import prices for vehicles and (nonfood) consumer goods to collapse consumer goods and vehicles into one measure. For both exports and imports these series show rising inflation tendencies. Even though the topography of the chart may seem shocking the scale is low to the acceleration in exports of consumer prices is up by just a percentage point since mid- 2005, a period of nearly 2 years. For imports the acceleration is about 1.8 percentage points from its low over the past year. But that acceleration brings the inflation rate UP TO only 1.6% Y/Y for ‘total’ consumer goods imports. Moreover that pace is not accelerating when looked at on shorter horizons such as the past three months or six months (see table below for consumer goods prices on imports and vehicle prices for imports).
We plot core consumer prices for goods on this same graph to show that export/import trends do not quickly or fully get into US consumer prices. Core goods consumer prices in fact are still in a slight DOWNTREND during this episode of export/import price inflation based on these constructed core export and import consumer price measures.
Overall export and import prices show accelerating trends based on the price movements of the energy component (embedded in industrial supplies). In contrast, capital goods prices show weakness. This is a bit of a concern since price weakness is often a sign of demand weakness (especially when commodity prices are not driving the result, as they would not be for capital goods). Since the main US export strength is in capital goods this could be an issue of adversity for US exporters. Weakening price for capital goods imports may also suggest weak capital spending domestically, although there were some signs of that picking up. By and large, the dollar weakness does not appear to have played much of a role for export and import prices although export prices are rising a bit faster than import prices as we might expect when the dollar is weak.
In part these results reflect that the dollar is weak Vs the Euro but it has (just) hit a 4 ½ year high Vs the yen and its drop Vs the Chinese yuan is ever so slow. Export and import prices trends reflect these glacial movements amid cross currents. Beyond these short trends (3-month, 6-month) the big picture still shows that export and import prices are rising as Y/Y inflation is getting a bit worse. But the rate of change is not a great worry for US policymakers; although it comes at time when their inflation fighting hackles are up, it is a trend that is moving in the WRONG direction.
| M/MO | Saar | |||||
| IMPORTS | Apr-07 | Mar-07 | Feb-07 | 3-Mo | 6-Mo | 12-Mo |
| ALL Imports | 1.3% | 1.5% | 0.4% | 13.3% | 7.2% | 1.9% |
| Excl Petrol | 0.2% | 0.3% | 0.0% | 1.9% | 3.7% | 2.9% |
| Petrol | 6.5% | 8.1% | 1.7% | 87.7% | 25.1% | -1.8% |
| Foods, Feeds and Beverages | 1.4% | -0.2% | 0.2% | 6.2% | 8.9% | 8.8% |
| Industrial Supplies | 3.7% | 4.5% | 1.0% | 43.6% | 19.9% | 3.2% |
| Capital goods | -0.4% | -0.2% | -0.3% | -3.9% | -1.5% | -0.4% |
| Motor Vehicles & Parts | 0.0% | 0.1% | 0.1% | 0.8% | 0.4% | 0.9% |
| Consumer Goods excl Autos | 0.1% | 0.1% | 0.0% | 0.8% | 1.6% | 1.9% |
| M/MO | Saar | |||||
| EXPORTS | Apr-07 | Mar-07 | Feb-07 | 3-Mo | 6-Mo | 12-Mo |
| ALL Exports | 0.3% | 0.6% | 0.8% | 7.3% | 6.6% | 4.9% |
| Agriculture | -1.3% | 2.0% | 2.8% | 15.0% | 24.0% | 19.0% |
| Non Agriculture | 0.4% | 0.5% | 0.6% | 6.6% | 5.3% | 3.9% |
| Foods, Feeds and Beverages | -0.8% | 2.3% | 3.2% | 20.1% | 24.9% | 20.2% |
| Industrial Supplies | 1.3% | 1.7% | 2.0% | 22.2% | 15.4% | 10.2% |
| Capital goods | -0.1% | -0.1% | 0.0% | -0.8% | 0.4% | 0.5% |
| Motor Vehicles & Parts | 0.1% | 0.1% | 0.1% | 1.1% | 1.3% | 1.3% |
| Consumer Goods excl Autos | 0.5% | 0.0% | 0.0% | 1.9% | 2.7% | 2.6% |
by Robert Brusca June 13, 2007
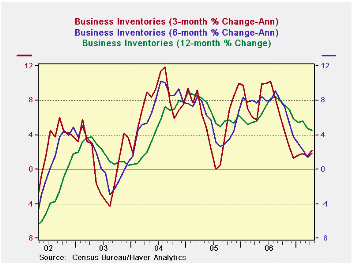
The inventory cycle appears to be winding down. Three-month inventory growth rates peaked in July of 2006 and have now decelerated to growth of 1.3% and begun to rise again. Equally as important however, is the upturn in sales.
The first table below puts these trends together and reveals sector detail. The very goods news is that over the last three- and six-months the three major sectors, wholesaling, retailing and manufacturing, each has seen the growth in sales exceed the growth in inventories. This means that Inventory/Sales (I/S) ratios have been reduced in each sector over the past six months. This sort of stock whittling is an encouragement to firms to rebuild inventories.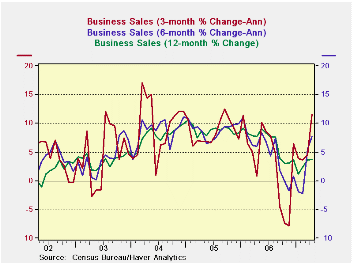
Moreover, the growth rate of sales has become quite strong and although retailing seems to lag, new figures for May tell us that retail sales are back in a strong growth profile. Over the past two years, however, manufacturers have had a problem: sales over the last 12 months and the past 24 months have lagged the growth in inventories leaving stocks ‘toppish’ relative to sales levels. For this sector even the robust - nearly 10% rise in nominal sales over the last 3-mos - will be a slow-acting medicine for inventory revival. Manufacturers will want to see more, or at least more sustainability.
Caveat: The top part of the first table below is all about dynamics: comparing the growth of inventories to the growth in sales over various periods. The changes in this growth balance are the stuff that shifting business fortunes are assessed over. But we also need to anchor these assessments, since the ebb and flow of sales versus inventories can make the relationship of ‘I’ to ‘S’ unclear. The bottom panel of the table provides an assessment of I to S ratios for that purpose. We also calculate the current I/S ratio as a percentage of its range over the last three years.
The latter calculation shows that while inventories are lean they are not so in all sectors. Wholesaling shows the lowest I to S ratio in three years. Retail inventories also are lean as they reside in the bottom 7 percentile of their 3-year range. As sales pick up, each of these sectors should see inventories grow as stock-to-sales ratios are so lean. But manufacturers, despite seeing the light at the end of their tunnel have been in that tunnel for a long time and have seen false glimmerings of light before. Inventories there are still in the top one quarter of their recent range for them. This not enough to keep them cutting stocks even as sales have truly picked up, so do not expect too much stock-building from this sector.
A second caveat is to be careful of aggregation when looking at inventories.
The second table below details retailing by sector and we see that lean motor vehicle inventories are driving the low reading for this sector (motor vehicles make up 43% of the sectors’ stocks, so that is not surprising). While most other industry groups within retailing are in good shape, building materials, with its stock-to-sales ratio at a three year high, is a clear exception. We do know that retail sales kicked it up a notch in May so these figures in the table below are going to look even better next month. But this is a warning that inventory figures are tricky and require a lot of effort to be well understood. For this sector, truth, not just the devil, is in the details. The aggregate figures really tell you nothing.
Summary:
On balance, these trends mean that US production should NOT get a huge kick from inventory-building since reporting factories are located in the US and if they build stocks they build them from US generated output by definition. And factories appear to be the laggard sector. Retailers, on the other hand, when they rebuild, will rebuild using imports to a great degree.
One implication of these trends is that imports are about to increase their growth to replenish dissipated stocks at the retail level. Wholesalers have a good complement of consumer goods and imports as well. The factory sector is the one that will kick US production into high gear when it rebuilds and so far that sector is still in the ‘yellow light’ region, not the ‘green light’ region, of its cycle at least for inventory building. But better times should be coming to that sector before long, especially if the current pace of sales has staying power.
| 3-Mo Growth | 6-Mo Growth | 12-Mo Growth | Yr Ago Growth | I:S ratio | |||||
| 2007 Apr | Sales | Inventory | Sales | Inventory | Sales | Inventory | Sales | Inventory | Percentile |
| Total Business | 11.7% | 2.2% | 7.7% | 1.9% | 3.8% | 4.6% | 7.7% | 5.6% | 33.3% |
| Manufacturers | 9.9% | 2.9% | 4.8% | 1.8% | 0.5% | 4.7% | 6.1% | 7.1% | 75.0% |
| Retailers | 6.3% | -0.2% | 6.2% | 0.0% | 2.9% | 2.5% | 7.0% | 2.9% | 6.7% |
| Wholesalers | 19.3% | 4.3% | 12.8% | 4.6% | 8.8% | 7.1% | 10.4% | 7.3% | 0.0% |
| Ratio of Stocks to Sales: Stocks Vs Flows | |||||||||
| Inventory-to-Sales Ratios In Perspective | Over three Years | ||||||||
| 2007 Apr | Current | 3-Mo Ago | 6-Mo Ago | Yr Ago | 2-Yrs Ago | 3-Yrs Ago | Percentile | Max | Min |
| Total Business | 1.27 | 1.30 | 1.31 | 1.26 | 1.29 | 1.29 | 33.3% | 1.31 | 1.25 |
| Manufacturers | 1.24 | 1.26 | 1.26 | 1.19 | 1.18 | 1.18 | 75.0% | 1.27 | 1.15 |
| Retailers | 1.46 | 1.49 | 1.51 | 1.47 | 1.53 | 1.58 | 6.7% | 1.6 | 1.45 |
| Wholesalers | 1.12 | 1.16 | 1.16 | 1.14 | 1.17 | 1.14 | 0.0% | 1.18 | 1.12 |
| 2007 Apr | 3-Mo Growth | 6-Mo Growth | 12-Mo Growth | Year Ago Growth | 3-Yr | ||||
| Sales | Inventory | Sales | Inventory | Sales | Inventory | Sales | Inventory | Percentile | |
| Retail Total | 6.3% | -0.2% | 6.2% | 0.0% | 2.9% | 2.5% | 7.0% | 2.9% | 11.1% |
| Excl Motor Vehicles | 7.1% | 3.3% | 7.4% | 3.5% | 3.2% | 4.3% | 8.9% | 3.9% | 14.3% |
| Sectors | |||||||||
| Motor Vehicles & Parts | 3.8% | -7.4% | 2.2% | -7.2% | 2.0% | -1.3% | 1.2% | 0.8% | 50.0% |
| Furniture, Electronics & Appliance | -0.4% | -0.1% | 4.8% | 1.1% | 3.1% | 1.0% | 8.2% | 5.9% | 18.2% |
| Building Materials | -4.4% | 15.8% | -1.2% | 2.6% | -5.6% | 1.7% | 14.4% | 9.4% | 100.0% |
| Clothing & Accessories | -4.9% | -1.8% | 3.9% | 7.9% | 4.6% | 8.5% | 5.6% | 5.6% | 76.2% |
| General Merchandise Stores | -1.3% | 3.9% | 4.3% | 5.3% | 3.1% | 7.4% | 6.2% | -2.0% | 50.0% |
| Percentage of Sectors where Sales Growth Exceeds Inventory Growth | |||||||||
| Sector Diffusion | 20 | 40 | 40 | 80 | |||||
by Carol Stone June 13, 2007
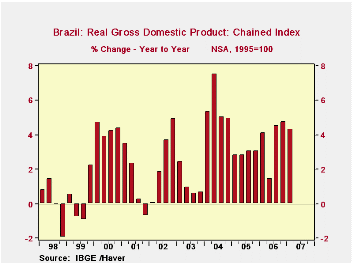
Q1 GDP in Brazil grew 3.1% from Q4 (seasonally adjusted) and 4.3% from the year earlier. This represents a modest slowing from recent performance, as the 3.1% follows 12 quarters that averaged 4.4%. Still, the Brazilian economy looks to be on a strong trend overall.
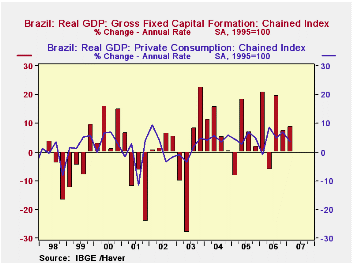 Fixed investment and exports were the main drivers of growth in Q1. Investment expanded at an 8.9% rate up from 7.5% in Q4. Exports swung from a decrease of 4.7% in Q4 to an increase of the same size in Q1. Exports are moderating from a period of rapid, but erratic, expansion that ran from late 2002 through Q3 2006. Possibly a strengthening currency is starting to be felt in export markets, or simply, after such strong growth, some consolidation is occurring. The strong currency argument has some force however in the trend of imports, which surged ahead at a 17.5% annual rate in Q1 and were almost 20% higher than the year-ago quarter.
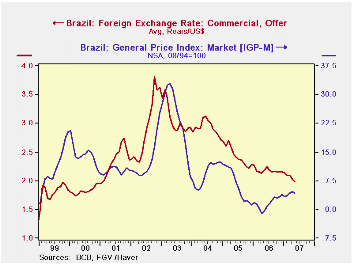
Consumer spending was up "only" 3.7% in Q1, but had risen considerably more in prior quarters, putting it up 6.0% over the past year.
We'll admit some surprise at the strength in Brazil (although analysts who follow it closely had projected slightly faster Q1 growth, according to one press report) but several conditions are favorable. Inflation, although above its lows, has diminished significantly from spurts in 2002-3 and 2004-5. The currency, in turn, has strengthened, as seen in the last graph here, where it fell just below 2 reais per US dollar in May, the most favorable exchange rate since early 2001, to say nothing of the mid-1990s periods of revaluation. So the Brazilian economy is settling and stabilizing. Haver and NTC Economics recently added a PMI index for manufacturing and a number of clients were anxious to get a look at it, even though there are only 15 months of history -- the May value was just above 54%, suggesting moderately widespread growth of manufacturing activity. But the point is that there is widening interest in the Brazilian economy, a diverse place with mineral resources and 187 million people (all told; a labor force count says there are just over 40 million people in the major urban areas, comparable to Argentina's 35.3 million).
| BRAZIL | Q1 2007* | Q4 2006* | Year Ago* | 2006 | 2005 | 2004 |
|---|---|---|---|---|---|---|
| Real GDP (1995=100) | 134.81 | 133.80 | 129.38 | 132.12 | 126.47 | 122.86 |
| % Change | 3.1 | 4.3 | 4.3 | 3.7 | 2.9 | 5.7 |
| Private Consumption | 3.7 | 6.8 | 6.0 | 4.3 | 4.7 | 3.8 |
| Gross Fixed Investment | 8.9 | 7.5 | 7.2 | 8.7 | 3.6 | 9.1 |
| Exports | 4.7 | -4.7 | 5.9 | 4.6 | 10.1 | 15.3 |
| Imports | 17.5 | 16.1 | 19.9 | 18.1 | 9.3 | 14.4 |

Robert Brusca
AuthorMore in Author Profile »Robert A. Brusca is Chief Economist of Fact and Opinion Economics, a consulting firm he founded in Manhattan. He has been an economist on Wall Street for over 25 years. He has visited central banking and large institutional clients in over 30 countries in his career as an economist. Mr. Brusca was a Divisional Research Chief at the Federal Reserve Bank of NY (Chief of the International Financial markets Division), a Fed Watcher at Irving Trust and Chief Economist at Nikko Securities International. He is widely quoted and appears in various media. Mr. Brusca holds an MA and Ph.D. in economics from Michigan State University and a BA in Economics from the University of Michigan. His research pursues his strong interests in non aligned policy economics as well as international economics. FAO Economics’ research targets investors to assist them in making better investment decisions in stocks, bonds and in a variety of international assets. The company does not manage money and has no conflicts in giving economic advice.
More Economy in Brief