 Global| Nov 07 2007
Q3 Productivity Stronger, Unit Labor Costs Fell
by:Tom Moeller
|in:Economy in Brief
Summary
Nonfarm labor productivity surged 4.9% last quarter, more than double the rise during the second quarter. The increase was the quickest since the third quarter of 2003 and it lifted the y/y gain in productivity to its highest since [...]
Nonfarm labor productivity surged 4.9% last quarter, more than double the rise during the second quarter. The increase was the quickest since the third quarter of 2003 and it lifted the y/y gain in productivity to its highest since early 2005. Consensus estimates had been for a 3.0% rise,
Responsible for the surge was just a modest increase in the gain in output to 4.3% from a 4.2% rise during 2Q. An outright decline in hours worked, at a 0.5% rate, provided most of the oomph. The decline followed 2.0% growth during 2Q and it was the largest quarterly drop in over four years.
Moving with the gain in productivity was a q/q acceleration in
compensation per hour last quarter growth to 4.7%.
The modest acceleration from 2Q was sufficient to jump the annual gain
in compensation to 6.7%, its fastest since 2000.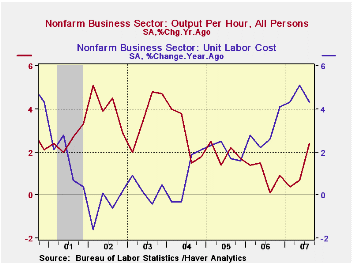
As a result of the productivity surge, unit labor costs posted the first decline in over a year. As a result of that decline the y/y increase moderated, but just a bit, to 4.3% from 5.1% in 2Q.
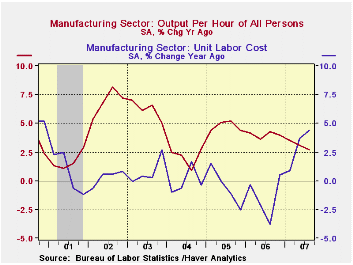
Productivity in the factory sector showed similar improvement with a 4.6% gain. It was about double the 2Q increase but like the nonfarm total, the rise came more from a decline in hours worked than from a quicker gain in output. Compensation growth in the factory sector actually cooled a bit to 2.3% q/q but that did not prevent the annual gain from accelerating to 7.2%, its fastest since late 2003. Unit labor costs in the factory sector dropped 2.2%, the first decline in a year, but the annual increase rose to 4.4%.
As Boomers Slow Down, So Might the Economy from the Federal Reserve Bank of St. Louis is available here.
This morning's testimony by Fed
Governor Frederic S. Mishkin on the Availability of Credit to Small Businesses can be found here| Non-farm Business Sector (SAAR) | Q3 '07 Prelim. | Q2 '07 | Y/Y | 2006 | 2005 | 2004 |
|---|---|---|---|---|---|---|
| Output per Hour | 4.9% | 2.2% | 2.4% | 1.0% | 1.9% | 2.7% |
| Compensation per Hour | 4.7% | 4.4% | 6.7% | 3.9% | 4.0% | 3.6% |
| Unit Labor Costs | -0.2% | 2.2% | 4.3% | 2.9% | 2.0% | 0.9% |
by Robert Brusca November 7, 2007
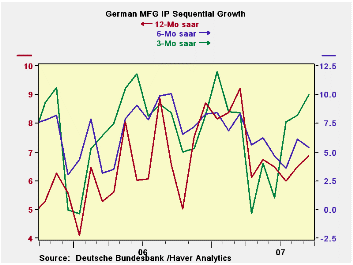
Most recent German reports have shown some weakening trends especially the new industrial orders. But in September IP itself was strong even as the outlook was weakening. The strength in output is mostly in capital goods where output is rising at a 12.5% pace in Q3, quite heated. Compare that to a 0.3% annual rate of increase for consumer goods in the quarter. For the moment intermediate goods output is strong, up at an 8.9% pace. The last three months show a real push in output that contrasts sharply with the weakness we have seen in new orders. This could be the turning point for German growth. Even the IFO report shows German MFG turning toward slower, not faster, growth. IP seems to be a lagging indicator in this process.
| German Industrial Production | |||||||
|---|---|---|---|---|---|---|---|
| Saar except m/m | Sep-07 | Aug-07 | Jul-07 | 3-mo | 6-mo | 12-mo | Quarter-to-Date |
| IP total | 0.3% | 1.9% | 0.2% | 9.7% | 5.5% | 6.1% | 8.5% |
| Consumer | -0.3% | 4.2% | -1.3% | 10.6% | 0.6% | 3.6% | 0.3% |
| Capital | 0.1% | 1.6% | 1.3% | 12.5% | 7.9% | 8.3% | 12.5% |
| Intermediate | 0.2% | 1.5% | -0.1% | 7.0% | 5.1% | 7.1% | 8.9% |
| Memo | |||||||
| Construction | 0.7% | 2.0% | 0.9% | 15.6% | -7.6% | -2.4% | 4.9% |
by Carol Stone November 7, 2007
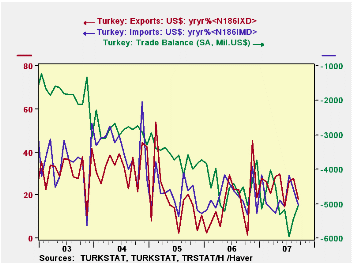
Turkey's economic fortunes currently are tied to their export activities. Through Q2 2007, GDP was up 3.9% from a year ago, while exports of goods and services according to the national accounts definition were up 12.7% in 1987 prices. Exports of goods in the trade accounts remained quite strong in Q3 through August, although they slowed in September. A volume index was up 16.1% in August from the corresponding 2006 value; it trailed off in September to just a 3.5% gain, making Q3 by this measure up 10.4% from Q3 2006. The manufacturing sector remains vigorous for the most part, as a slower September, up 4.1%, followed 15.4% in August, making a Q3 average of 10.9% growth. As we noted here last winter, the automobile industry is a particular highlight; September detail is not yet available, but July and August were up nearly 15% from the year earlier.
Imports too are expanding in Turkey. In Q2, the national
accounts measure showed 8.4% growth from a year ago, actually somewhat
slower than other recent periods; this coincided with an 8.1% gain in
the volume index. But Q3 saw a surge in the latter, by 15.3%. The
acceleration is in manufactured goods, up 16.8% in the quarter.
Agricultural imports are small, but they have been expanding greatly,
and were up almost 45% in the first nine months of this year from the
year earlier.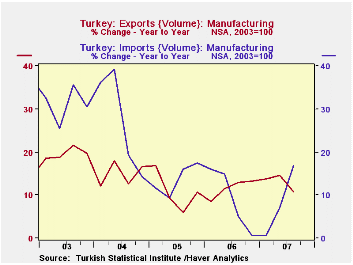
Turkey's overall trade balance has sustained a declining
trend, despite the strength in exports, since imports remain noticeably
larger. So a much larger percentage increase in exports is needed to
produce a big enough dollar amount to overcome a more moderate increase
in imports. The numbers that have obtained put the September deficit
right at $5.0 billion, down somewhat from July and August's $6.2 and
$6.3 billion, respectively, and mildly worse than the $4.5 billion
deficit during 2006.
| TURKEY, Seas. Adj. | Sept 2007 | Aug 2007 | July 2007 | Monthly Averages | ||
|---|---|---|---|---|---|---|
| 2006 | 2005 | 2004 | ||||
| Trade Balance, SA, Mil.US$ | -$5.0 | -$6.3 | -$6.2 | -$4.5 | -$3.6 | -$2.9 |
| Exports, SA, Mil.US$ | $8.7 | $9.6 | $8.8 | $7.1 | $6.1 | $5.3 |
| Volume Index* | 3.5% | 16.1% | 12.5% | 12.2% | 10.4% | 13.7% |
| Imports, SA, Mil.US$ | $13.7 | $15.0 | $14.8 | $11.6 | $9.7 | $8.1 |
| Volume Index* | 6.5% | 19.4% | 20.5% | 8.4% | 12.2% | 20.6% |
Tom Moeller
AuthorMore in Author Profile »Prior to joining Haver Analytics in 2000, Mr. Moeller worked as the Economist at Chancellor Capital Management from 1985 to 1999. There, he developed comprehensive economic forecasts and interpreted economic data for equity and fixed income portfolio managers. Also at Chancellor, Mr. Moeller worked as an equity analyst and was responsible for researching and rating companies in the economically sensitive automobile and housing industries for investment in Chancellor’s equity portfolio. Prior to joining Chancellor, Mr. Moeller was an Economist at Citibank from 1979 to 1984. He also analyzed pricing behavior in the metals industry for the Council on Wage and Price Stability in Washington, D.C. In 1999, Mr. Moeller received the award for most accurate forecast from the Forecasters' Club of New York. From 1990 to 1992 he was President of the New York Association for Business Economists. Mr. Moeller earned an M.B.A. in Finance from Fordham University, where he graduated in 1987. He holds a Bachelor of Arts in Economics from George Washington University.
More Economy in Brief
 Global| Feb 05 2026
Charts of the Week: Balanced Policy, Resilient Data and AI Narratives
by:Andrew Cates


