 Global| Dec 05 2007
Q3 Productivity Revised Up, Unit Labor Costs Revised Down
by:Tom Moeller
|in:Economy in Brief
Summary
Due mostly to an upward revision in output, nonfarm labor productivity growth last quarter was revised up to 6.3% from 4.9%. The revised gain matched Consensus estimates and it was the quickest quarterly rise in four years. The [...]
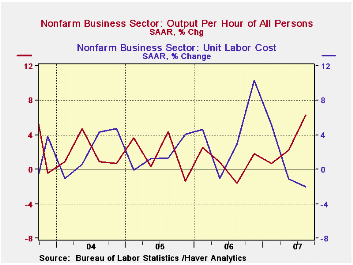
Due mostly to an upward revision in output, nonfarm labor productivity growth last quarter was revised up to 6.3% from 4.9%. The revised gain matched Consensus estimates and it was the quickest quarterly rise in four years.
The largest factor behind the revision came from output growth to 5.7% from the preliminary 4.3%. More output from fewer hours worked. Hours worked were revised little and now are estimated to have fallen 0.6%, the largest quarterly drop in over four years.
Revised in the opposite direction, compensation
per hour last quarter was taken down to 4.2%. Despite that
revision, as well as a deceleration in compensation growth from
outsized gains during 1Q & 4Q '06, the annual gain in
compensation of 5.8% was its quickest since 2000.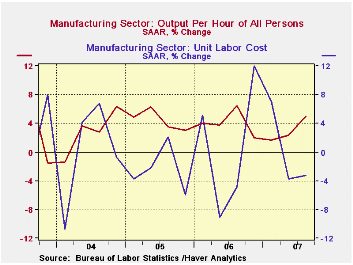
The combination of more productivity and less compensation lowered unit labor cost growth to -2.0% from -0.2%, again the weakest since 2004.That was enough to drop the y/y gain to its lowest in a year.
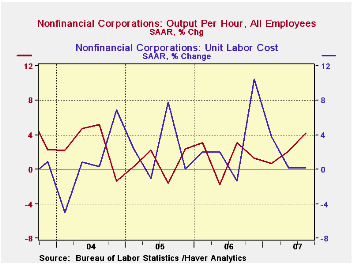
Released for the first time with this report were figures for the nonfinancial corporate sector. Output per hour there rose 4.2%, its quickest since 2004. The gain was accompanied by a moderate 4.4% rise in compensation and that left unit labor costs about flat as they were in 2Q. Raising costs, however, were two large increases during 1Q and 4Q '06. They raised the y/y gain in unit labor costs to 3.6%, its fastest in two years.
Productivity in the factory sector also was revised up, but to a lesser extent, to 5.0% from a preliminary 4.6% gain. It was double the 2Q increase and it still owed to a slight decline in hours worked accompanied by a swift 4.5% gain in output. Compensation growth in the factory sector made up for a 2Q decline with a 1.5% rise. That left the y/y gain stable at 5.6%, its fastest since early 2005. Unit labor costs in the factory sector fell a revised 3.3%, about as they did in the initial report. The annual increase was lowered a bit 2.8%, still the quickest since late 2000.
How well do wages follow productivity growth? from the Federal Reserve Bank of St. Louis can be found here.
| Non-farm Business Sector (SAAR) | Q3 '07 Revised | Q3 '07 Prelim. | Q2 '07 | Y/Y | 2006 | 2005 | 2004 |
|---|---|---|---|---|---|---|---|
| Output per Hour | 6.3% | 4.9% | 2.2% | 2.7% | 1.0% | 1.9% | 2.7% |
| Compensation per Hour | 4.2% | 4.7% | 4.4% | 5.8% | 3.9% | 4.0% | 3.6% |
| Unit Labor Costs | -2.0% | -0.2% | 2.2% | 3.0% | 2.9% | 2.0% | 0.9% |
by Tom Moeller December 5, 2007
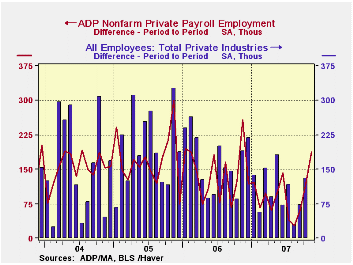
The ADP National Employment Report, reported by the payroll processor, indicated that private nonfarm payroll growth improved further to 189,000 during November after a revised 119,000 rise in October.
The U.S. Bureau of Labor Statistics employment figure for November will be published this Friday.Last month, ADP's measure of private nonfarm payrolls for October indicated the upwardly revised 119,000 increase in jobs that was followed by a 73,000 gain in private nonfarm payrolls.
The sub-index for large payrolls made for a piece of the declines during the prior five months with a 30,000 increase
The sub-index for small payrolls outpaced a firm October rise with a 77,000 increase.
According to ADP and Macro Advisers, the correlation between the monthly percentage change in the ADP estimate and that in the BLS data is 0.90.
ADP compiled the estimate from its database of individual companies' payroll information. Macroeconomic Advisers, LLC, the St. Louis economic consulting firm, developed the methodology for transforming the raw data into an economic indicator.
The ADP National Employment Report data is maintained in
Haver's USECON database; historical data
go back to December 2000. The figures in this report cover only private
sector jobs and exclude employment in the public sector, which rose an
average 11,083 during the last twelve months.
The full ADP National Employment Report can be found here, and the ADP methodology is explained here.
| LAXEPA@USECON | November | October | Y/Y | 2006 | 2005 | 2004 |
|---|---|---|---|---|---|---|
| Nonfarm Private Payroll Employment (m/m Chg.) | 189,000 | 119,000 | 1.0% | 1.7% | 1.8% | 1.3% |
by Tom Moeller December 5, 2007
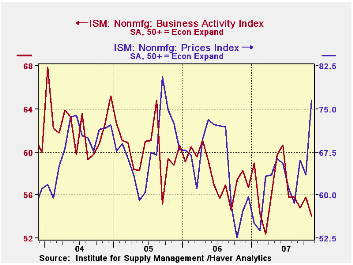
According to the Institute for Supply Management, the November Business Activity Index for the non-manufacturing sector slipped to 54.1 from 55.8. A figure above 50 indicates rising activity and the m/m decline somewhat outpaced Consensus expectations for a lesser fall.
Since the series' inception in 1997 there has been a 44% correlation between the level of the Business Activity Index in the non-manufacturing sector and the Q/Q change in real GDP for the services and the construction sectors. The correlation of the factory sector ISM index with the change in real GDP less just services is a higher 57%, though over the last ten years it only has been 34%.
The new orders sub index of the Business Activity fell sharply to 51.1 from 55.7. The latest was the lowest reading since early 2003.
The employment sub index similarly fell to 50.8, just barely
suggesting rising employment. Since the series' inception in 1997 there
has been a 56% correlation between the level of the ISM
non-manufacturing employment index and the m/m change in payroll
employment in the service producing plus the construction industries.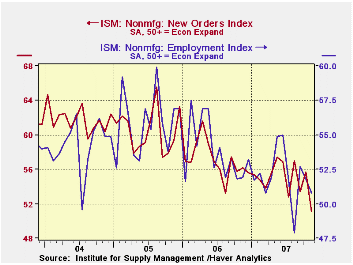
Pricing power surged m/m to its highest level since 2005. Since inception ten years ago, there has been a 60% correlation between the price index and the q/q change in the GDP services chain price index.
ISM surveys more than 370 purchasing managers in more than 62 industries including construction, law firms, hospitals, government and retailers. The non-manufacturing survey dates back to July 1997.
The Business Activity Index for the non-manufacturing sector reflects a question separate from the subgroups mentioned above. In contrast, the ISM manufacturing sector composite index is a weighted average of five components.
| ISM Nonmanufacturing Survey | November | October | November '06 | 2006 | 2005 | 2004 |
|---|---|---|---|---|---|---|
| Business Activity Index | 54.1 | 55.8 | 57.4 | 58.0 | 60.2 | 62.5 |
| Prices Index | 76.5 | 63.5 | 52.6 | 65.2 | 68.0 | 68.8 |
by Tom Moeller December 5, 2007
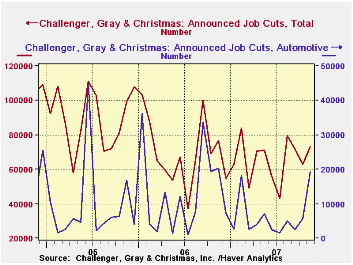
Challenger, Grey & Christmas reported that job cut announcements in November picked up slightly to 73,140 from 63,114 during October. The number of job cut announcements has moved roughly sideways this year at a level reduced from prior years.
Job cut announcements rose sharply m/m in the auto industry (-5.8% y/y) and energy (637.2% y/y) but showed little up or down movement in most others.
During the last ten years there has been a 79% (inverse) correlation between the three month moving average of announced job cuts and the three month change payroll employment.
Job cut announcements differ from layoffs. Many are achieved through attrition, early retirement or just never occur.
Challenger also reported that announced hiring plans were roughly stable with the prior three months.
| Challenger, Gray & Christmas | November | October | Y/Y | 2006 | 2005 | 2004 |
|---|---|---|---|---|---|---|
| Announced Job Cuts | 73,140 | 63,114 | -4.7% | 839,822 | 1,072,054 | 1,039,935 |
by Tom Moeller December 5, 2007
Factory inventories ticked up 0.1% during October following a 0.6% surge in September. The three month in manufacturers' inventories remained stable at 2.3% (AR) but that was much more moderate than in prior years.
Excluding the volatile transportation sector, inventories were
unchanged also after a 0.6% September increase. Three month
accumulation at a 2.1% also is down from 7.1% for all of last year. The
slowdown continued in inventories of computers & electronic
products to a three month growth rate of 4.4% versus 10.4% last year
and inventories of industrial machinery rose 1.9% following a 22.8%
jump last year. Electrical equipment inventories have been falling
since mid-year after 25.2% growth in 2006. 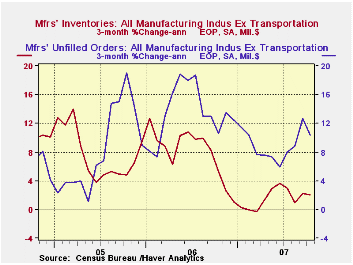
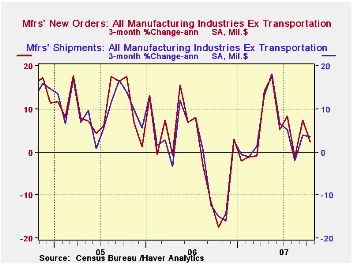
Factory shipments surged 1.0% in October but weakness during prior months left three month growth at -2.3% (AR). Much of that weakness has been due to the automotive and aircraft industries. Excluding transportation altogether, October shipments rose 1.1% and the three month growth rate was somewhat reduced at 3.7% versus 5.0% growth last year.
Total factory orders continue to hold little promise for a pickup in factory sector activity. A 0.5% October gain followed a like rise in September but three month growth fell to -10.2% (AR). The 0.4% October decline in durable goods orders in the advance report was little revised.
Unfilled orders rose 1.0%, about the same as in prior months. Excluding, the transportation industries unfilled orders rose 0.8% and the three month growth rate was double digit with a 10.4% rise.
| Factory Survey (NAICS) | October | September | Y/Y | 2006 | 2005 | 2004 |
|---|---|---|---|---|---|---|
| Inventories | 0.1% | 0.6% | 2.2% | 6.4% | 8.9% | 7.7% |
| New Orders | 0.5% | 0.3% | 5.0% | 5.1% | 11.6% | 6.9% |
| Shipments | 1.0% | 0.1% | 4.7% | 4.3% | 10.3% | 6.9% |
| Unfilled Orders | 1.0% | 1.1% | 17.9% | 20.0% | 15.0% | 3.9% |
by Robert Brusca December 5, 2007
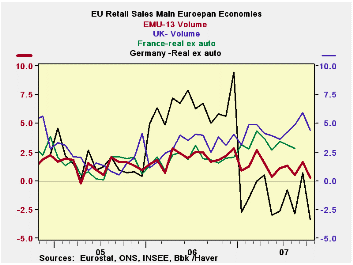
Retails sales trends in EMU/EU countries that seemed like they
might have been acquiring some life have turned lower in October.
As the first month in a new quarter, the October readings
afford us an early look at the speed of sales in the new quarter. We
find that retail sales volumes are dropping at a 3.7% annual rate in Q4
in the EMU-13 area. Spending on food is up in the quarter at a 0.1%
annualized rate; nonfood items have volumes contracting at a pace of
-5.6%.
Sequential growth rates for nonfood and overall retail sales
have been showing clear deceleration.
In Germany sales are weakening fast. In the UK the slowing is
itself in slow-motion, but the deceleration is still clear to see.
The table below shows that momentum in retail sales volumes
has been fading. Europe is slipping regardless of the optimism there.
| Euro area 13 Retail Sales Volume | ||||||
|---|---|---|---|---|---|---|
| Oct-07 | Sep-07 | Aug-07 | 3-Mo | 6-MO | 12-Mo | |
| Euro area 13 Total | -0.8% | 0.2% | 0.0% | -2.2% | -0.6% | 0.3% |
| Food | -0.2% | 0.2% | 0.2% | 0.8% | -1.0% | 0.2% |
| Nonfood | -1.1% | 0.2% | -0.2% | -3.9% | -0.4% | 0.4% |
| Textiles | N/A | 1.9% | -0.3% | 10.9% | 7.2% | 8.2% |
| HH Goods | N/A | -1.2% | 0.5% | -0.8% | -0.3% | 0.9% |
| Books newspapers & others | N/A | -0.3% | -0.4% | -0.8% | 0.7% | 1.6% |
| Pharmaceuticals | N/A | 0.6% | 0.2% | 4.7% | 4.2% | 4.2% |
| Other nonspecial store sales | N/A | 0.7% | -0.6% | -0.3% | -0.8% | -0.1% |
| Mail Order | N/A | -0.1% | 0.0% | -2.3% | 3.7% | 3.2% |
| Nonfood Volume | ||||||
| Germany | -3.8% | 0.4% | 0.3% | -11.8% | -8.3% | -4.0% |
| France | N/A | 0.5% | -0.4% | 2.9% | 4.5% | 5.2% |
| Italy (Total Value) | N/A | -0.5% | -0.1% | -2.6% | -2.9% | -2.2% |
| UK (EU) | 0.1% | 0.4% | 0.7% | 4.9% | 6.5% | 6.7% |
| Shaded areas calculated on a one-month lag due to lagging data. | ||||||
| The EA 13 countries are Austria, Belgium, Finland, France, Germany, Greece, Ireland, Italy, Luxembourg, the Netherlands, Portugal, Slovenia and Spain. | ||||||
by Robert Brusca December 5, 2007
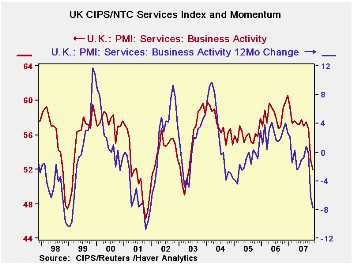
The UK services PMI from NTC is falling sharply. It dropped
sharply in October and again in November. Among the three key PMI
sectors, manufacturing, construction and services, the services index
has the weakest reading as it resides in the 32nd percentile of its
range. There are only three episodes since 1998 when the services
reading was weaker than it is now. Each time in the past when the
service sector index fell to where it stands today, it was simply on
its way to a much lower level. Be advised.
| MFG, Construction and Services PMI CIPS/NTC | ||||||
|---|---|---|---|---|---|---|
| Monthly readings | Change over: | percentile | ||||
| Nov-07 | Oct-07 | 3MO | 6MO | 12MO | of range | |
| MFG | 54.38 | 52.82 | -1.61 | -0.38 | 1.61 | 65.8 |
| Construction | 54.32 | 57.41 | -10.50 | -3.69 | -0.46 | 36.1 |
| Services | 51.95 | 53.08 | -5.60 | -5.23 | -7.83 | 32.9 |
| MFG range since January 1992; Construction Since April 1997 Services Since July 1996 | ||||||

Tom Moeller
AuthorMore in Author Profile »Prior to joining Haver Analytics in 2000, Mr. Moeller worked as the Economist at Chancellor Capital Management from 1985 to 1999. There, he developed comprehensive economic forecasts and interpreted economic data for equity and fixed income portfolio managers. Also at Chancellor, Mr. Moeller worked as an equity analyst and was responsible for researching and rating companies in the economically sensitive automobile and housing industries for investment in Chancellor’s equity portfolio. Prior to joining Chancellor, Mr. Moeller was an Economist at Citibank from 1979 to 1984. He also analyzed pricing behavior in the metals industry for the Council on Wage and Price Stability in Washington, D.C. In 1999, Mr. Moeller received the award for most accurate forecast from the Forecasters' Club of New York. From 1990 to 1992 he was President of the New York Association for Business Economists. Mr. Moeller earned an M.B.A. in Finance from Fordham University, where he graduated in 1987. He holds a Bachelor of Arts in Economics from George Washington University.
More Economy in Brief


