 Global| Apr 29 2004
Q1 2004 GDP Light at 4.2%
by:Tom Moeller
|in:Economy in Brief
Summary
US real GDP grew a less than expected 4.2% last quarter, about the same as in 4Q03. During the last four quarters GDP growth of 4.9% is an improvement from 0.0% at the end of 2001 and the fastest since 1984. The Consensus expectation [...]
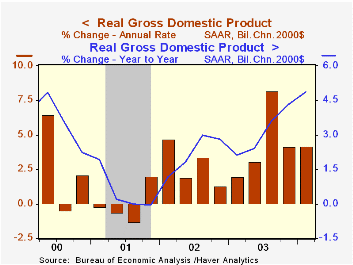
US real GDP grew a less than expected 4.2% last quarter, about the same as in 4Q03. During the last four quarters GDP growth of 4.9% is an improvement from 0.0% at the end of 2001 and the fastest since 1984. The Consensus expectation was for 5.0% growth in 1Q.
Personal consumption expenditures grew at a 3.8% (4.3% y/y) rate, up a bit from 3.2% growth in 4Q. The increase was held back by a 4.7% decline in durables spending, down due to lower light vehicle sales.
Nonresidential fixed investment rose 7.2% (AR, 9.4% y/y), down slightly from the 10.9% and 12.8% growth during the prior two quarters. Structures investment fell for the third straight quarter but equipment & software investment held firm at 11.4% (12.9% y/y).
Residential investment growth was light at 2.1% (8.8% y/y), down from 7.9% and 21.9% growth in the prior two quarters. The rise actually was a bit better than suggested by the monthly reports on construction.
Government spending rose at only a 2.0% rate due to a 2.6% (-0.5% y/y) decline in state & local. Federal spending jumped 10.1% (8.5% y/y) on a 15.1% (13.5% y/y) rise in defense spending.
Additional investment in inventories added 0.3 percentage points to GDP growth, half the contribution in 4Q.
Trade sector improvement added marginally to GDP growth as exports grew 3.2% (7.8% y/y) and imports rose 2.0% (6.9% y/y).
Corporate profits for 4Q03 were unrevised. Operating profits rose 7.2% (29.0% y/y) following a 9.9% jump in 3Q. "Recent Revisions to Corporate Profits: What We Know and When We Knew It" from the Federal Reserve Bank of New York is available here.
Prices rose at the fastest clip since 2Q 2001. The 2.5% rise in the chain price index was goosed by a 3.2% rise in the PCE price index. Non-durable prices surged 5.3% on higher gasoline prices. Durable goods prices have been falling since 1995 though the rate of decline was a modest 0.3% in 1Q. Business equipment & software prices fell 0.5% (-0.0% y/y).
| Chained 2000$, % AR | 1Q '04 (Advance) | 4Q '03 (Final) | Y/Y | 2003 | 2002 | 2001 |
| GDP | 4.2% | 4.1% | 4.9% | 3.1% | 2.2% | 0.5% |
| Inventory Effect | 0.3% | 0.7% | 0.2% | -0.1% | 0.4% | -0.9% |
| Final Sales | 3.9% | 3.4% | 4.7% | 3.2% | 1.8% | 1.4% |
| Trade Effect | 0.0% | -0.3% | 0.0% | -0.2% | -0.6% | -0.2% |
| Domestic Final Demand | 3.7% | 3.6% | 4.7% | 3.4% | 2.4% | 1.6% |
| Chained GDP Price Index | 2.5% | 1.5% | 1.7% | 1.7% | 1.5% | 2.4% |
| Chained 2000$, % AR | 1Q '04 (Advance) |
4Q '03 (Final) |
Y/Y | 2003 | 2002 | 2001 |
|---|---|---|---|---|---|---|
| GDP | 4.2% | 4.1% | 4.9% | 3.1% | 2.2% | 0.5% |
| Inventory Effect | 0.3% | 0.7% | 0.2% | -0.1% | 0.4% | -0.9% |
| Final Sales | 3.9% | 3.4% | 4.7% | 3.2% | 1.8% | 1.4% |
| Trade Effect | 0.0% | -0.3% | 0.0% | -0.2% | -0.6% | -0.2% |
| Domestic Final Demand | 3.7% | 3.6% | 4.7% | 3.4% | 2.4% | 1.6% |
| Chained GDP Price Index | 2.5% | 1.5% | 1.7% | 1.7% | 1.5% | 2.4% |
by Tom Moeller April 29, 2004
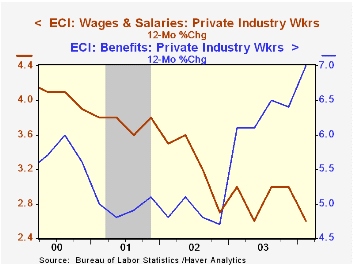
The employment cost index for workers in private industry jumped 1.1% last quarter, ahead of Consensus expectations for a 0.9% gain.
Benefit costs in private industry surged 2.6% in 1Q, the fastest quarterly increase since 1982. The gain was driven by a rise in payments by companies to defined benefit pension plans. Health insurance benefit inflation cooled slightly to 9.3% y/y from 10.5% in 2003.
Wages and salaries, which account for roughly 70% of the compensation index, grew 0.6% last quarter versus 0.5% gain in 4Q.
| ECI- Private Industry Workers | 1Q'04 | 4Q'03 | Y/Y | 2003 | 2002 | 2001 |
|---|---|---|---|---|---|---|
| Compensation | 1.1% | 0.8% | 3.9% | 4.0% | 3.2% | 4.2% |
| Wages & Salaries | 0.6% | 0.5% | 2.6% | 3.0% | 2.7% | 3.8% |
| Benefit Costs | 2.6% | 1.4% | 7.0% | 6.4% | 4.7% | 5.1% |
by Tom Moeller April 29, 2004
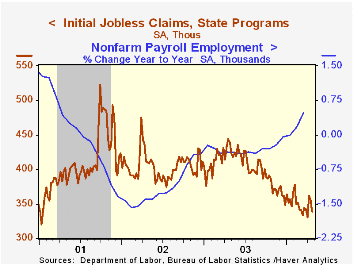
Initial claims for jobless insurance fell 18,000 last week to 338,000, the lowest level in three weeks. Consensus expectations had been for a decline to 345,000 claims. Claims during the prior week were revised up slightly.
The 4-week moving average of initial claims fell slightly to 346,500 (-20.0% y/y).
Continuing claims for unemployment insurance rose 3,000 but the prior week's jump was revised down to 43,000.
The insured rate of unemployment was unchanged at 2.4% for the eighth consecutive week. This unemployment rate averaged 2.8% during 2002 and 2003.
| Unemployment Insurance (000s) | 4/24/04 | 4/17/04 | Y/Y | 2003 | 2002 | 2001 |
|---|---|---|---|---|---|---|
| Initial Claims | 338 | 356 | -23.0% | 403 | 404 | 406 |
| Continuing Claims | -- | 3,013 | -17.3% | 3,533 | 3,573 | 3,023 |
by Tom Moeller April 29, 2004
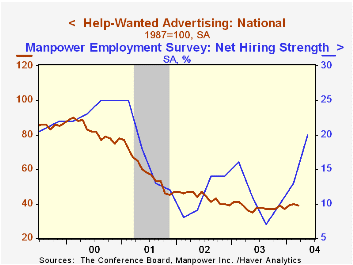
The Conference Board’s National Index of Help-Wanted Advertising ticked lower to 39 last month versus 40 in February. Despite the drop, the 1Q average improved slightly versus most of last year.
Improvement in the Manpower Employment Outlook Survey for 2Q04 portends a gain in the help wanted index. During the last ten years there has been a 74% correlation between the help wanted index and the Manpower Survey.
There has been a 93% correlation between the level of help-wanted advertising and the year-to-year change in non-farm payrolls.
A note of caution came as the proportion of labor markets with rising want-ad volume fell sharply to 22% from over 60% in January & February.
The Conference Board surveys help-wanted advertising volume in 51 major newspapers across the country every month.
| Conference Board | Mar | Feb | Mar '03 |
|---|---|---|---|
| National Help Wanted Index | 39 | 40 | 39 |

Tom Moeller
AuthorMore in Author Profile »Prior to joining Haver Analytics in 2000, Mr. Moeller worked as the Economist at Chancellor Capital Management from 1985 to 1999. There, he developed comprehensive economic forecasts and interpreted economic data for equity and fixed income portfolio managers. Also at Chancellor, Mr. Moeller worked as an equity analyst and was responsible for researching and rating companies in the economically sensitive automobile and housing industries for investment in Chancellor’s equity portfolio. Prior to joining Chancellor, Mr. Moeller was an Economist at Citibank from 1979 to 1984. He also analyzed pricing behavior in the metals industry for the Council on Wage and Price Stability in Washington, D.C. In 1999, Mr. Moeller received the award for most accurate forecast from the Forecasters' Club of New York. From 1990 to 1992 he was President of the New York Association for Business Economists. Mr. Moeller earned an M.B.A. in Finance from Fordham University, where he graduated in 1987. He holds a Bachelor of Arts in Economics from George Washington University.
More Economy in Brief


