 Global| Jun 06 2007
Productivity is Down and Unit Labor Costs are Up
Summary
Productivity is trending lower for manufacturing (MFG) as well as overall for nonfarm businesses. The accompanying chart makes the downturn clear. For nonfarm business the erosion seems to date back to mid-2005. For nonfarm [...]
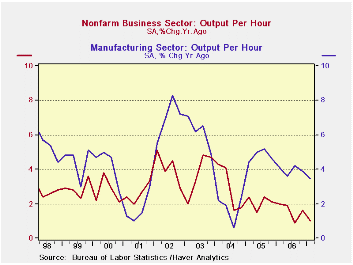
Productivity is trending lower for manufacturing (MFG) as well as overall for nonfarm businesses. The accompanying chart makes the downturn clear. For nonfarm business the erosion seems to date back to mid-2005. For nonfarm productivity it looks like a trend decline is still in train - that would be very bad news indeed. It’s bad enough that productivity has slowed to 1% Yr/Yr.
With productivity at 1% Yr/Yr and population growth at about 1% Yr/Yr, GDP growth faces strong constraints. While labor force growth can surpass population growth, one-half of one percent is about all the extra growth it might be prudent to look for. And to encourage greater labor force participation it generally takes higher wages and that would be a problem for the Fed since it is trying to keep inflation contained. On balance, 2.5% growth seems about the limit to GDP under this new productivity growth rate scenario.
Of course productivity is a fickle series. The chart on the left shows a good deal of variation in Yr/Yr growth. Quarterly growth in productivity and GDP can move around by a lot more. Still it is the trend we should be most concerned with. That is what the Fed will be looking at as it makes an assessment of its own policy options.
The main implication of structurally weaker productivity growth is that the Fed will be seeing the economy with a lower speed limit. This is something markets have been having a hard time dealing with for sometime now. We have seen the slowing in labor force growth that has meant that 118K jobs per month (in nonfarm payrolls) is all that the job market needs to produce to steady the unemployment rate. Now a lower GDP number will also associate with that weaker job growth.
The paradox is that this low growth will not be a cause for alarm that growth is slipping, rather the Fed will get worried about inflation pressures and speeding at growth rates that used to be quite acceptable and sustainable.
Productivity is one of the most important contributors to growth and it is one of the most volatile. As such it is a variable that is hard to pin down. Even so the Fed will not be pleased with the new result and the trend it hints at.
A diminished trend in productivity means that wage pressures can become inflation problems more easily. With high productivity in train sizeable wage increases can be blunted and ‘paid for’ by accelerated productivity growth. But when productivity growth is low, firms have to be more careful about giving in to wage demands since the productivity cushion is smaller.
In Q1 2007 compensation per hour of 3.2% less productivity of 1% leaves unit labor costs higher by 2.2%. In Q4 of 2005 compensation per hour of 3.7% translated into unit labor costs of just +1.5% because productivity was up by 2.1%.
With the Fed putting the top of its inflation comfort zone at 2% in terms of Core PCE it is easy to see that wages are to be held in a narrow band if productivity stays this low and if the Fed is to be successful in keeping inflation at bay.
| Year/Year Pct | 07/Q1 | 06/Q4 | 06/Q3 | 06/Q2 | 06/Q1 | 05/Q4 |
| NF Unit Labor Cost | 2.2% | 4.0% | 2.6% | 3.1% | 3.6% | 1.5% |
| NF Output/Hr | 1.0% | 1.6% | 0.9% | 1.9% | 2.0% | 2.1% |
| NF Comp/Hr | 3.2% | 5.6% | 3.5% | 5.1% | 5.7% | 3.7% |
| NF Real Comp/Hr | 0.7% | 3.6% | 0.1% | 1.0% | 1.9% | 0.0% |
| Manufacturing | ||||||
| MFG Unit Labor Cost | -0.4% | 0.7% | -2.3% | 0.1% | 2.0% | -1.2% |
| MFG Output/Hour | 3.5% | 3.9% | 4.2% | 3.6% | 4.1% | 4.6% |
| MFG Comp/Hour | 3.1% | 4.6% | 1.8% | 3.7% | 6.1% | 3.4% |
| MFG Real Comp/Hour | 0.6% | 2.6% | -1.5% | -0.3% | 2.3% | -0.4% |
by Robert Brusca June 6, 2007
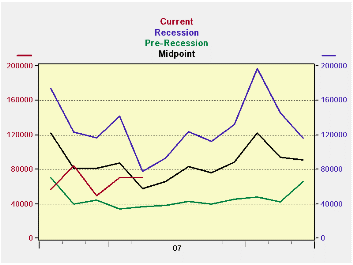
The first issue to grapple with in trying to assess the Challenger report is that its data are not seasonally adjusted. At the same time it is clear that this series has seasonal patterns. To get around this we compare the data to the year before.. We also have created the accompanying chart that plots each month of the year in a non-binding tunnel bearing two values representing averages for each month drawn from the period of recession and depressed growth as well as from the pre-recession times when layoffs were much lower. We add, as another reference line to the chart, the midpoint between these two cases. The chart reveals that the 2007 figures were regularly at or below the midpoint line until May when the level of layoffs is higher relative to that standard. It may be that the economy is throwing off more layoffs in May than what is normal either because of calendar quirks or because of a real deterioration that is setting in.
But the chart, even though it uses NSA data, flags May 2007 as a month of backtracking on reducing layoffs.
The comprehensive table below provides even more comparisons. May ranks as the fifth highest layoff total in the past 14 years. April was also the fifth highest layoff month. March had ranked 9th and layoffs appeared as if they were diminishing. The three-month average ranks sixth over these same 14 years. The six-month average ranks eighth. The 12-month is displayed in the table and as of May that ranks 8th. So the ranking has been creeping up as we shorten the length to measure the moving average or to look at the month directly. The improving trend is not so clear any more, indeed it appears to have switched to one of deterioration. We can see that there has been some slippage compared to historic standards; standards that are free from the effects of seasonality.
A slight bump up in the layoff pace is not an unequivocal message.
But the steadiness of the slippage of the rankings on shorted moving averages is indicative of a true deterioration. A pick up in layoffs need not be a sign of economic weakness, however. At the moment both jobless claims and nonfarm job growth are indicating that the job market is solid – as is the 4.5% rate of unemployment. Layoffs are another way to supply labor to an already tight labor market. We know that manufacturing firms continue to shed employees and have been doing so for decades. With the pick up in M&A activity it is no surprise that layoffs step-up since that is one common result of mergers and their drive for greater efficiency.
The gradual up turn in layoffs is a trend to be aware of, but is not yet a clear signal for policy. It may be constructive or it may be a sign of true erosion and of encroaching weakness. It bears watching.
| Rank of | "13-Yr" | |||||||
|---|---|---|---|---|---|---|---|---|
| Challenger, Gray and Christmas: | 3-Mo Avg | 6-Mo Avg | 12-Mo Avg | 12-Mo | Rank Of | |||
| May | Apr | Mar | May | May | May | Average | May | |
| Announced Layoffs: 2007 | 71,115 | 70,672 | 48,997 | 63,595 | 65,736 | 67,523 | 8 | 5 |
| Same Mo. Year ago (2006): | 53,716 | 59,688 | 64,975 | 59,460 | 79,514 | 84,503 | 6 | 9 |
| Same Mo. Year ago (2005): | 82,283 | 57,861 | 86,396 | 75,513 | 89,387 | 88,218 | 5 | 2 |
| Same Mo. 2-Years ago (2004): | 73,368 | 72,184 | 68,034 | 71,195 | 83,569 | 89,500 | 4 | 4 |
| Same Mo. 3-Years ago (2003): | 68,623 | 146,399 | 85,396 | 100,139 | 110,622 | 113,426 | 2 | 6 |
| Same Mo .4-Years ago (2002): | 84,978 | 112,649 | 102,315 | 99,981 | 139,686 | 154,906 | 1 | 1 |
| Same Mo.5-years ago (2001): | 80,140 | 165,564 | 162,867 | 136,190 | 131,037 | 74,439 | 7 | 3 |
| Same Mo.6-years ago (2000): | 27,036 | 37,291 | 55,783 | 40,037 | 41,644 | 103,205 | 3 | 12 |
| Same Mo.7-years ago (1999): | 55,231 | 54,399 | 68,984 | 59,538 | 70,553 | 65,201 | 9 | 8 |
| Same Mo.8-years ago (1998): | 27,631 | 48,758 | 23,028 | 33,139 | 45,637 | 39,950 | 11 | 11 |
| Same Mo.9-years ago (1997): | 21,004 | 15,214 | 50,182 | 28,800 | 34,646 | 31,851 | 13 | 13 |
| Same Mo.10-years ago (1996): | 30,845 | 30,810 | 37,486 | 33,047 | 47,598 | 41,526 | 10 | 10 |
| Same Mo.11-years ago (1995): | 58,530 | 15,678 | 27,809 | 34,006 | 33,240 | 35,253 | 12 | 7 |
| Comparative Data | May | Apr | Mar | Values for previous months | ||||
| Recession & Post Recession | 3-Mo | 6-Mo | 12-Mo | Month of | May | |||
| Median (3-Yrs) | 80,140 | 146,399 | 102,315 | 100,139 | 131,037 | 113,426 | tends to be | lower than |
| Pre-Recession (1995-2000) | Apr | 60.0% | ||||||
| Median (6-Yrs) | 29,238 | 83,524 | 77,190 | 79,759 | 90,588 | 88,822 | of the | time |
| MIDPOINT-Median | 54,689 | 114,962 | 89,753 | 89,949 | 110,812 | 101,124 | ||
| % of Pre & Post Gap | 82.3% | -20.4% | -112.2% | -79.3% | -61.4% | -86.6% | ||
by Carol Stone June 6, 2007
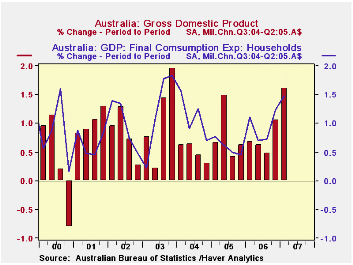
Australian GDP grew 1.6% in Q1, up from 1.1% in Q4 and the strongest quarter since Q4 2003. This compared with 1.3% expected in one major forecast survey. Year-to-year growth was 4.0%. Data for Australia are contained in Haver's ANZ database and in G10+ as well as numerous international databases from the OECD, IMF and others.
The pick-up resulted from positive inputs in several demand areas. Private consumption was up 1.5% compared to 1.2% the quarter before. Exports expanded 1.4%, up from 1.0%, while growth in imports was lower, 2.1% from 6.5%. This latter, of course, helps raise the total growth rate since imports enter the GDP calculation negatively. 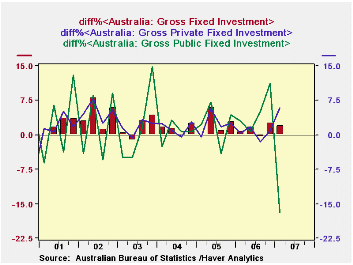
Fixed capital formation grew nicely as well, although the Q1 rise of 2.0% was less than Q4's 2.6%. It is important to note here the impact of the privatization of the telephone and telecommunications utility in Australia, Telstra. The government sold this company to private owners in November and it enters the GDP accounts in the private investment category for the first time in this report. Thus, the 5.8% surge in private fixed investment and the 16.9% plunge in public investment exaggerate the underlying movements. The Australian Bureau of Statistics reports that private investment would still have looked pretty good, at 4.8% growth in Q1, if the telephone company had been in the private sector all during Q4 as well. Public investment would still have fallen in Q1, but by "only" 7.5%. These latter growth rates are recorded in a footnote in our ANZ menu.
Interestingly, among the various industrial sectors, manufacturing output declined, despite the gain in overall GDP. Gross value added in manufacturing eased by 0.5%, although that did follow two very good quarters of 1.7% and 2.0%. Agricultural output also declined, but only 0.3% and far less than in the prior two quarters. So agriculture actually contributed to the increase in GDP growth by subtracting less. Construction activity gained 2.5%, a reputable figure, but less than Q4's 3.9%. The best performances came in retail trade, up 2.4%, and finance, up 2.3%, with both at least a percentage point stronger than the quarter before.
| AUSTRALIA, % Chg, Chn A$, Q3/2004-Q2/2005 |
Q1 2007* | Q4 2006* | Q3 2006* | Year Ago | 2006 | 2005 | 2004 |
|---|---|---|---|---|---|---|---|
| Real GDP | 1.6 | 1.1 | 0.5 | 4.0 | 2.7 | 2.7 | 3.7 |
| Private Consumption | 1.5 | 1.2 | 0.7 | 4.2 | 3.1 | 3.0 | 5.7 |
| Gross Fixed Capital Formation | 2.0 | 2.6 | -0.5 | 5.8 | 6.3 | 7.8 | 7.5 |
| Private | 5.8** | 0.9 | -1.5 | 7.1 | 5.4 | 7.6 | 7.1 |
| Public | -16.9** | -11.3 | 5.2 | -2.1 | 11.9 | 8.7 | 9.9 |
| Exports | 1.4 | 1.0 | 0.2 | 4.6 | 3.4 | 2.4 | 4.6 |
| Imports | 2.1 | 6.5 | -0.5 | 11.4 | 7.7 | 8.5 | 15.3 |
| Manufacturing | -0.5 | 2.0 | 1.8 | 3.3 | -1.3 | 0.2 | 0.0 |
| Finance & Insurance | 2.3 | 1.0 | 0.9 | 5.9 | 6.1 | 2.5 | 3.7 |

Robert Brusca
AuthorMore in Author Profile »Robert A. Brusca is Chief Economist of Fact and Opinion Economics, a consulting firm he founded in Manhattan. He has been an economist on Wall Street for over 25 years. He has visited central banking and large institutional clients in over 30 countries in his career as an economist. Mr. Brusca was a Divisional Research Chief at the Federal Reserve Bank of NY (Chief of the International Financial markets Division), a Fed Watcher at Irving Trust and Chief Economist at Nikko Securities International. He is widely quoted and appears in various media. Mr. Brusca holds an MA and Ph.D. in economics from Michigan State University and a BA in Economics from the University of Michigan. His research pursues his strong interests in non aligned policy economics as well as international economics. FAO Economics’ research targets investors to assist them in making better investment decisions in stocks, bonds and in a variety of international assets. The company does not manage money and has no conflicts in giving economic advice.
More Economy in Brief


