 Global| Jul 15 2005
Producer Prices Unexpectedly Weak
by:Tom Moeller
|in:Economy in Brief
Summary
The producer price index for finished goods was unexpectedly unchanged last month following the 0.6% decline in May which also was unexpected. Consensus expectations had been for a 0.4% rise in June. Excluding food & energy prices [...]
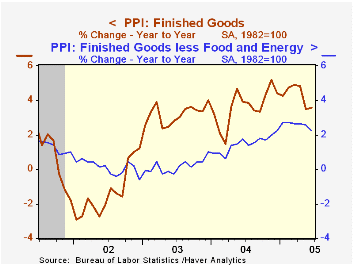
The producer price index for finished goods was unexpectedly unchanged last month following the 0.6% decline in May which also was unexpected. Consensus expectations had been for a 0.4% rise in June. Excluding food & energy prices were also surprisingly weak, falling 0.1% versus the expectation for a 0.1% rise.
Prices for core finished consumer goods fell 0.1% (+2.4% y/y) due to to a 2.0% (NSA, +1.4% y/y) decline in passenger car prices. Consumer durable goods prices overall fell 0.4% (+0.5% y/y). Showing strength, core consumer nondurable goods prices rose 0.3% (3.8% y/y) but capital goods prices fell 0.2% (+2.1% y/y).
Finished energy prices rose 2.0% (13.1% y/y) while finished food prices fell 1.1% (+0.1% y/y).
Intermediate goods prices recovered 0.1% of the prior month's sharp drop as energy prices rose 1.9% (15.0% y/y). Pricing weakness, however, was indicated by the 0.2% decline in core intermediate goods prices.
Crude prices fell another 3.3% due to the 3.1% June decline crude energy prices which has since reversed. Core crude prices added 4.3% to the May decline. Iron & steel scrap prices fell 22.1% (NSA, -15.5% y/y). During the last thirty years "core" crude prices have been a fair indicator of industrial sector activity with a 48% correlation between the six month change in core crude prices and the change in factory sector industrial production.
| Producer Price Index | June | May | Y/Y | 2004 | 2003 | 2002 |
|---|---|---|---|---|---|---|
| Finished Goods | 0.0% | -0.6% | 3.6% | 3.6% | 3.2% | -1.3% |
| Core | -0.1% | 0.1% | 2.2% | 1.5% | 0.2% | 0.1% |
| Intermediate Goods | 0.1% | -0.7% | 6.1% | 6.6% | 4.6% | -1.5% |
| Core | -0.2% | -0.3% | 4.9% | 5.7% | 2.0% | -0.5% |
| Crude Goods | -3.3% | -2.0% | 1.7% | 17.5% | 25.1% | -10.6% |
| Core | -4.3% | -3.6% | 5.2% | 26.6% | 12.4% | 3.8% |
by Tom Moeller July 15, 2005
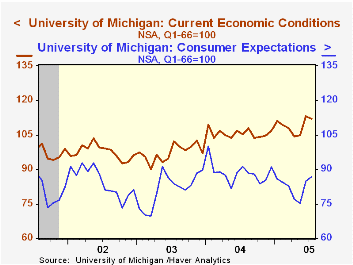
The University of Michigan's preliminary reading of consumer sentiment in July rose to 96.5 and added 0.5% to the 10.5% increase during June. Consensus expectations had been for a slight pullback to 95.0.
During the last ten years there has been a 74% correlation between the level of consumer sentiment and the y/y change in real PCE, although the correlation has fallen in recent years.
Consumer expectations rose 1.9% on top of the 12.9% surge during June but the reading of current economic conditions slipped 1.1%.
The University of Michigan survey is not seasonally adjusted.The mid-month survey is based on telephone interviews with 250 households nationwide on personal finances and business and buying conditions. The survey is expanded to a total of 500 interviews at month end.
The Weak Jobs Recovery: Whatever Happened To "The American Jobs Machine"? from the Federal Reserve Bank of New York can be found here.
| University of Michigan | July | June | Y/Y | 2004 | 2003 | 2002 |
|---|---|---|---|---|---|---|
| Consumer Sentiment | 96.5 | 96.0 | -0.2% | 95.2 | 87.6 | 89.6 |
| Current Conditions | 112.0 | 113.2 | 6.5% | 105.6 | 97.2 | 97.5 |
| Consumer Expectations | 86.6 | 85.0 | -5.0% | 88.5 | 81.4 | 84.6 |
by Tom Moeller July 15, 2005
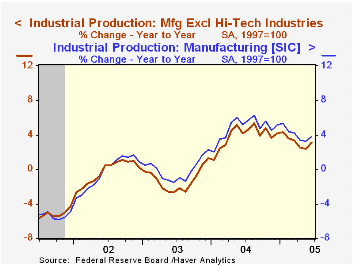
Industrial production in June jumped 0.9% and handily beat Consensus expectations for a 0.4% rise. The gain was inflated by warmer weather which raised utility output by 5.3%. Factory sector output rose 0.4% (3.8% y/y) following a downwardly revised 0.4% increase in May.
Output of computers & peripheral equipment jumped 1.3% (12.5% y/y) though high tech output overall rose just 0.3% (17.0% y/y). Excluding the high tech sector factory output rose 0.5% (3.1% y/y) due to a 2.9% (6.9% y/y) rise in motor vehicle output and a 0.8% (9.2% y/y) increase in aerospace. Electrical equipment fell 0.1% (+1.0% y/y) and machinery output rose 0.2% (7.0% y/y).
Total capacity utilization rose to 80.0% and capacity grew 1.1% y/y. Factory sector utilization rose to 78.4% versus 76.5% last June and capacity rose 1.3% y/y.
The Relationship Between Capacity Utilization and Inflation from the Federal Reserve Bank of Philadelphia can be found here.
| Production & Capacity | June | May | Y/Y | 2004 | 2003 | 2002 |
|---|---|---|---|---|---|---|
| Industrial Production | 0.9% | 0.3% | 4.0% | 4.1% | -0.0% | -0.3% |
| Consumer Goods | 1.2% | 0.7% | 4.1% | 2.7% | 0.3% | 1.4% |
| Business Equipment | 0.2% | 1.0% | 8.2% | 9.5% | 1.2% | -7.9% |
| Capacity Utilization | 80.0% | 79.4% | 77.8% (6/04) | 78.1% | 75.5% | 75.3% |
by Tom Moeller July 15, 2005
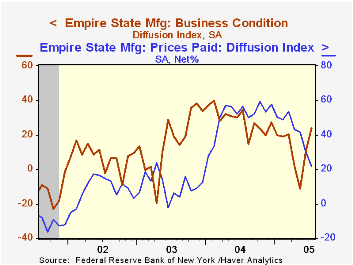
The July Empire State Index of General Business Conditions in New York's manufacturing industries doubled June's positive reading and rose to 23.91 versus 10.49. The two figures were the best back-to-back positive indications since March
The new orders component jumped to 19.15, the highest level since January and the shipments index also surged. The employment index gave back most of the prior month's gain. Like the Philadelphia Fed Index of General Business Conditions, the Empire State Business Conditions Index reflects answers to an independent survey question; it is not a weighted combination of the components.
The prices paid index fell sharply to the lowest level since December 2003.
Expectations for business conditions in six months improved to the highest level this year. Expectations for future capital spending also recovered to the highest level since April.
The Empire State Manufacturing Survey is a monthly survey of manufacturers in New York State conducted by the Federal Reserve Bank of New York. Participants from across the state in a variety of industries respond to a questionnaire and report the change in a variety of indicators from the previous month. Respondents also state the likely direction of these same indicators six months ahead. April 2002 is the first report, although survey data date back to July 2001.
For more on the Empire State Manufacturing Survey, including methodologies and the latest report, click here.
| Empire State Manufacturing Survey | July | June | July '04 | 2004 | 2003 | 2002 |
|---|---|---|---|---|---|---|
| General Business Conditions (diffusion index) | 23.91 | 10.49 | 34.65 | 28.76 | 16.17 | 7.19 |
by Tom Moeller July 15, 2005
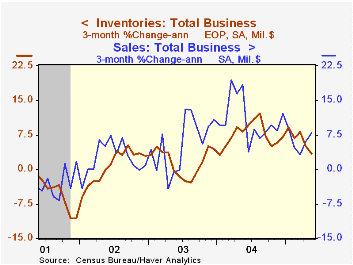
Total business inventories rose just 0.1% in May following a downwardly revised 0.2% gain in April. The three month change in inventories dropped to 3.3% (AR) versus the 12.1% peak rate of accumulation through last August. The ratio of inventories-to-sales held at the record low of 1.30.
Retail inventories rose 0.2% in May and the three month change remained low at 2.1% versus the peak of 12.4% last April. Excluding autos, however, retail inventories jumped 0.6% due to a 1.5% (7.1% y/y) surge in furniture.
Factory sector inventories were unchanged for the second month and three month growth fell to 2.7%.
Wholesale inventories rose just 0.1% and three month growth fell to 5.7%. During the last ten years there has been a 64% correlation between the y/y change in wholesale inventories and the change in imports of merchandise.
Overall business sales fell 0.1% (+6.9% y/y) following the 12.2% jump during April.
| Business Inventories | May | April | Y/Y | 2004 | 2003 | 2002 |
|---|---|---|---|---|---|---|
| Total | 0.1% | 0.2% | 7.0% | 7.7% | 1.4% | 1.6% |
| Retail | 0.2% | 0.1% | 3.7% | 5.7% | 3.9% | 5.9% |
| Retail excl. Autos | 0.6% | 0.2% | 6.1% | 5.9% | 2.0% | 2.3% |
| Wholesale | 0.1% | 0.7% | 10.4% | 10.8% | 2.0% | 1.2% |
| Manufacturing | 0.0% | -0.0% | 7.7% | 7.5% | -1.3% | -1.8% |
by Carol Stone July 15, 2005
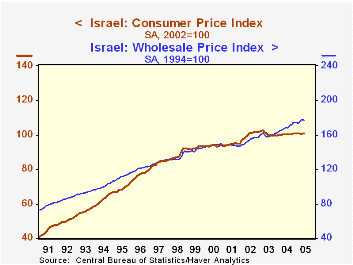
Israel's monthly price data were reported today by the Central Bureau of Statistics. The June consumer price index, like that in the US, was flat. It had risen 0.2% in May. The year-on-year rate is a mere 0.3%. For wholesale prices, the index for June fell 0.4%, although prior increases have put the year-on-year rate at 5.1%.
It's interesting to see in the first graph that the consumer and wholesale indexes moved along pretty much the same trend until 2002. Since then, the consumer price index has been almost flat, while the wholesale index has continued along its former trend or even somewhat stronger. Wholesale prices are domestic prices, those charged by manufacturers selling their finished output "at the factory gate". Input costs are likely a major determinant, and over the last five years there has been some correlation with oil prices, 57%, as seen in the second graph. Notably, this relationship was not so clear in prior years, but perhaps the wide swings in the oil market since 2000 have had an impact on this smaller country.
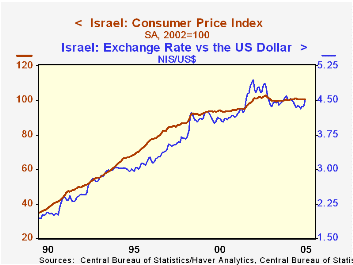
But then how can consumer prices be so stable? A quick look at the value of the shekel will give a good clue. In the third graph, it is seen to run very close to the level of the CPI. The foreign exchange rate is no trivial matter for the final price level. For the economy as a whole, imports run right at 50% of GDP. With imports so important, prices of imported products matter a great deal to pricing, so the fact that the shekel has steadied and even improved against the US dollar since mid-2002 has probably helped greatly in flattening the Israeli CPI. 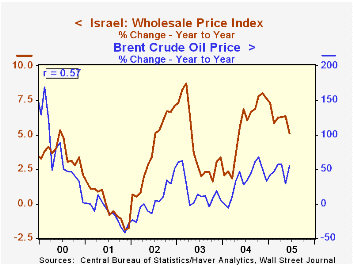
| % Changes; Yr/Yr calculated from NSA | June 2005 | May 2005 | Year/ Year | December/December|||
|---|---|---|---|---|---|---|
| 2004 | 2003 | 2002 | ||||
| Consumer Prices: "General Index" (SA) | 0.0 | 0.2 | 0.3 | 1.2 | -1.9 | 6.5 |
| Memo: Exchange Rate: Shekels/US$ | 4.4849 | 4.3737 | 4.5166 | 4.4820 | 4.5483 | 4.7378 |
| Wholesale Prices (NSA) | -0.4 | 0.6 | 5.1 | 7.6 | 3.3 | 6.9 |
| ex Fuel (NSA) | 0.4 | 0.2 | 4.1 | 5.2 | 2.9 | 5.6 |

Tom Moeller
AuthorMore in Author Profile »Prior to joining Haver Analytics in 2000, Mr. Moeller worked as the Economist at Chancellor Capital Management from 1985 to 1999. There, he developed comprehensive economic forecasts and interpreted economic data for equity and fixed income portfolio managers. Also at Chancellor, Mr. Moeller worked as an equity analyst and was responsible for researching and rating companies in the economically sensitive automobile and housing industries for investment in Chancellor’s equity portfolio. Prior to joining Chancellor, Mr. Moeller was an Economist at Citibank from 1979 to 1984. He also analyzed pricing behavior in the metals industry for the Council on Wage and Price Stability in Washington, D.C. In 1999, Mr. Moeller received the award for most accurate forecast from the Forecasters' Club of New York. From 1990 to 1992 he was President of the New York Association for Business Economists. Mr. Moeller earned an M.B.A. in Finance from Fordham University, where he graduated in 1987. He holds a Bachelor of Arts in Economics from George Washington University.
More Economy in Brief


