 Global| Dec 12 2003
Producer Prices Fell
by:Tom Moeller
|in:Economy in Brief
Summary
Finished producer prices in November reversed some of the prior month's strength and fell 0.3%. Consensus expectations had been for a 0.2% gain. Core producer prices also changed direction and fell 0.1% versus expectations for a 0.1% [...]
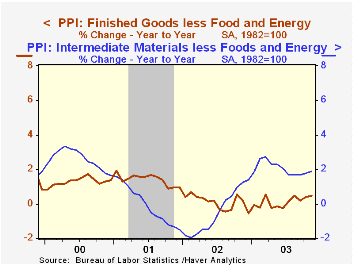
Finished producer prices in November reversed some of the prior month's strength and fell 0.3%. Consensus expectations had been for a 0.2% gain. Core producer prices also changed direction and fell 0.1% versus expectations for a 0.1% uptick.
Most of the unwinding of October's price strength was due to a decline in vehicle prices. Lower prices for passenger cars and light trucks left overall finished durable goods prices unchanged (1.1% y/y) following a 1.1% spike in October. Tobacco prices rose just 0.1% (-7.4% y/y) after a 0.5% October gain.
Lower truck prices pulled finished capital goods prices down 0.1% (0.9% y/y) following the 0.6% October surge.
Finished energy prices also were weak and fell 1.2% (9.7% y/y). The decline was due to the second monthly decline in gasoline prices (7.8% y/y) and lower fuel oil prices (12.5% y/y). These energy product price series are NSA.
Intermediate goods prices fell 0.2% as energy prices declined. Core intermediate prices rose a moderate 0.2%, but prices for hardwood lumber (8.9% y/y), plywood (39.9% y/y) and copper (11.1% y/y) were quite firm.
Crude goods prices rose just a modest 0.2%, held back by the fourth decline in five months in crude energy prices (11.3% y/y). Core crude prices were strong reflecting higher metals prices. Iron & steel scrap prices jumped 7.5% (45.7% y/y).
| Producer Price Index | Nov | Oct | Y/Y | 2002 | 2001 | 2000 |
|---|---|---|---|---|---|---|
| Finished Goods | -0.3% | 0.8% | 3.4% | -1.3% | 2.0% | 3.7% |
| Core | -0.1% | 0.5% | 0.5% | 0.1% | 1.4% | 1.3% |
| Intermediate Goods | -0.2% | 0.4% | 3.3% | -1.5% | 0.4% | 4.9% |
| Core | 0.2% | 0.3% | 1.9% | -0.5% | -0.1% | 2.6% |
| Crude Goods | 0.2% | 3.6% | 18.6% | -10.6% | 0.3% | 22.8% |
| Core | 4.3% | 3.1% | 17.4% | 3.8% | -10.0% | 7.4% |
by Tom Moeller December 12, 2003
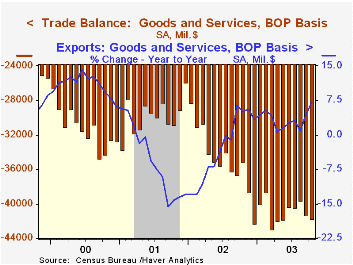
The U.S. foreign trade deficit deepened slightly and about as expected in October to $41.8B. The deficit in September was unrevised.
The trade deficit in petroleum products deepened to $10.0B ($121.6B AR, YTD) and the deficit in nonpetroleum product trade rose to $36.4B ($413.8B AR, YTD).
Exports jumped 2.6% (10.3% YTD, AR) as exports of capital goods surged for the second month, up 3.4% (16.8% YTD, AR) but nonauto consumer goods exports fell 2.3% (+9.9% YTD, AR).
Imports also rose strongly as nonpetroleum imports surged 3.1% (4.0% YTD, AR) and that offset a decline in petroleum imports. Nonauto consumer goods imports were up a strong 5.3%.
By country, the US trade deficit with China deepened to $13.6B in October and to $123.9B (AR) year to date versus a deficit of $103.1B last year. With Japan the US trade deficit deepened to $6.4B and to $65.4B (AR) year to date versus $70.0B last year. The US trade deficit with the European Union deepened to $8.7B and to $91.9B (AR) year to date versus a deficit of $82.1B last year.
Fed Chairman Greenspan's comments made yesterday on Capitalism and the Role of Globalization are available here.
| Foreign Trade | Oct | Sept | Y/Y | 2002 | 2001 | 2000 |
|---|---|---|---|---|---|---|
| Trade Deficit | $41.8B | $41.3B | $35.2B(10/02) | $418.0B | $357.8B | $375.4B |
| Exports - Goods & Services | 2.6% | 2.9% | 7.1% | -3.3% | -5.8% | 10.8% |
| Imports - Goods & Services | 2.1% | 3.4% | 10.6% | 2.0% | -5.5% | 17.8% |
by Tom Moeller December 12, 2003
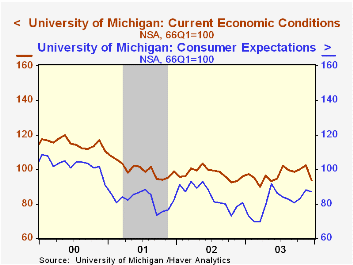
The University of Michigan’s consumer sentiment index fell unexpectedly in mid-December to 89.6 and fully reversed the prior month's increase. Consensus expectations had been for a slight rise to 95.5.
During the last ten years there has been a 71% correlation between the level of consumer sentiment and the y/y change in real PCE. That correlation has risen to 82% during the last five years.
The current conditions index fell sharply to 93.6, the lowest level since May. The decline was due to consumers' less favorable perception of their financial situation.
The expectations index fell moderately to 87.1, just off the highs for the year.
The University of Michigan survey is not seasonally adjusted.It is based on telephone interviews with 250 households nationwide on personal finances and business and buying conditions. The survey is expanded to a total of 500 interviews at month end.
| University of Michigan | Mid-Dec | Nov | Y/Y | 2002 | 2001 | 2000 |
|---|---|---|---|---|---|---|
| Consumer Sentiment | 89.6 | 93.7 | 3.3% | 89.6 | 89.2 | 107.6 |
| Current Conditions | 93.6 | 102.5 | -2.5% | 97.5 | 100.1 | 115.2 |
| Consumer Expectations | 87.1 | 88.1 | 7.8% | 84.6 | 82.3 | 102.7 |

Tom Moeller
AuthorMore in Author Profile »Prior to joining Haver Analytics in 2000, Mr. Moeller worked as the Economist at Chancellor Capital Management from 1985 to 1999. There, he developed comprehensive economic forecasts and interpreted economic data for equity and fixed income portfolio managers. Also at Chancellor, Mr. Moeller worked as an equity analyst and was responsible for researching and rating companies in the economically sensitive automobile and housing industries for investment in Chancellor’s equity portfolio. Prior to joining Chancellor, Mr. Moeller was an Economist at Citibank from 1979 to 1984. He also analyzed pricing behavior in the metals industry for the Council on Wage and Price Stability in Washington, D.C. In 1999, Mr. Moeller received the award for most accurate forecast from the Forecasters' Club of New York. From 1990 to 1992 he was President of the New York Association for Business Economists. Mr. Moeller earned an M.B.A. in Finance from Fordham University, where he graduated in 1987. He holds a Bachelor of Arts in Economics from George Washington University.
More Economy in Brief


