 Global| Mar 21 2006
Producer Price Index Down, Core Prices Firm
by:Tom Moeller
|in:Economy in Brief
Summary
The Producer Price Index for Finished Goods fell 1.4% last month. It was the largest decline in the index since April 2003 and easily outpaced Consensus expectations for a 0.3% decline. Producer prices less food & energy (core), [...]
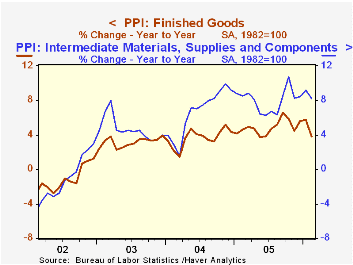
The Producer Price Index for Finished Goods fell 1.4% last month. It was the largest decline in the index since April 2003 and easily outpaced Consensus expectations for a 0.3% decline.
Producer prices less food & energy (core), however, rose 0.3% and were stronger than expectations for a 0.1% increase. The gain was boosted by strength in floor coverings (9.4% y/y), mobile homes (4.9% y/y), construction machinery (6.6% y/y), power transformers (9.7% y/y), heavy motor trucks (4.1% y/y) and civilian aircraft (4.3% y/y).
Prices of all finished consumer goods less food & energy rose 0.2% (1.8% y/y) and core consumer nondurable goods prices increased 0.4% (2.8% y/y). Capital equipment prices increased a modest 0.1% (1.5% y/y), held back by another decline in electronic computer prices (-22.6% y/y).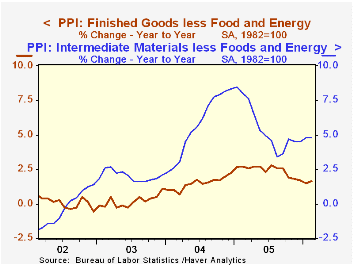
Finished energy prices slumped 4.7% (+16.9% y/y) during February as gasoline prices dropped 11.0% (+18.4% y/y). Home heating oil also fell by 1.1% (+29.0% y/y) along with natural gas prices which fell 4.1% (+25.6% y/y). Residential electric power costs were unchanged after a 3.0% January rise (8.8% y/y).
Intermediate goods prices eased 0.3% after the 1.2% January surge although core intermediate prices continued strong with a 0.5% advance.
Crude goods prices dropped sharply as crude energy prices tumbled 16.2% (+26.0% y/y). In March, the volatility in crude oil prices has left the average about even with last month. Core crude prices rose a sharp 3.3% on the strength of high prices for copper base scrap (59.4% y/y), aluminum scrap (30.3% y/y) and iron & steel scrap (3.9% y/y). During the last thirty years "core" crude prices have been a fair indicator of industrial sector activity with a 48% correlation between the six month change in core crude prices and the change in factory sector industrial production.
Reflections on the Yield Curve and Monetary Policy, remarks by Federal Reserve Board Chairman Ben S. Bernanke can be found here.
| Producer Price Index | Feb | Jan | Y/Y | 2005 | 2004 | 2003 |
|---|---|---|---|---|---|---|
| Finished Goods | -1.4% | 0.2% | 3.8% | 4.9% | 3.6% | 3.2% |
| Core | 0.3% | 0.4% | 1.7% | 2.4% | 1.5% | 0.2% |
| Intermediate Goods | -0.3% | 1.2% | 8.2% | 8.0% | 6.6% | 4.7% |
| Core | 0.5% | 1.0% | 4.8% | 5.5% | 5.7% | 2.0% |
| Crude Goods | -9.2% | -0.5% | 12.8% | 14.6% | 17.5% | 25.1% |
| Core | 3.3% | -0.1% | 11.9% | 4.9% | 26.5% | 12.4% |

Tom Moeller
AuthorMore in Author Profile »Prior to joining Haver Analytics in 2000, Mr. Moeller worked as the Economist at Chancellor Capital Management from 1985 to 1999. There, he developed comprehensive economic forecasts and interpreted economic data for equity and fixed income portfolio managers. Also at Chancellor, Mr. Moeller worked as an equity analyst and was responsible for researching and rating companies in the economically sensitive automobile and housing industries for investment in Chancellor’s equity portfolio. Prior to joining Chancellor, Mr. Moeller was an Economist at Citibank from 1979 to 1984. He also analyzed pricing behavior in the metals industry for the Council on Wage and Price Stability in Washington, D.C. In 1999, Mr. Moeller received the award for most accurate forecast from the Forecasters' Club of New York. From 1990 to 1992 he was President of the New York Association for Business Economists. Mr. Moeller earned an M.B.A. in Finance from Fordham University, where he graduated in 1987. He holds a Bachelor of Arts in Economics from George Washington University.
More Economy in Brief


