 Global| Mar 21 2006
Producer Price Index Down, Core Prices Firm
by:Tom Moeller
|in:Economy in Brief
Summary
The Producer Price Index for Finished Goods fell 1.4% last month. It was the largest decline in the index since April 2003 and easily outpaced Consensus expectations for a 0.3% decline. Producer prices less food & energy (core), [...]
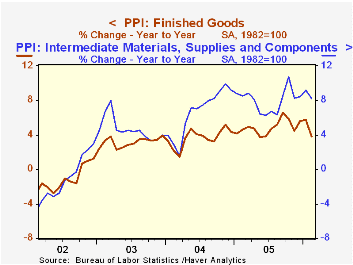
The Producer Price Index for Finished Goods fell 1.4% last month. It was the largest decline in the index since April 2003 and easily outpaced Consensus expectations for a 0.3% decline.
Producer prices less food & energy (core), however, rose 0.3% and were stronger than expectations for a 0.1% increase. The gain was boosted by strength in floor coverings (9.4% y/y), mobile homes (4.9% y/y), construction machinery (6.6% y/y), power transformers (9.7% y/y), heavy motor trucks (4.1% y/y) and civilian aircraft (4.3% y/y).
Prices of all finished consumer goods less food & energy rose 0.2% (1.8% y/y) and core consumer nondurable goods prices increased 0.4% (2.8% y/y). Capital equipment prices increased a modest 0.1% (1.5% y/y), held back by another decline in electronic computer prices (-22.6% y/y).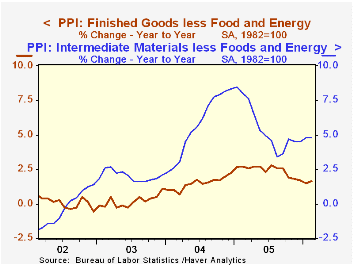
Finished energy prices slumped 4.7% (+16.9% y/y) during February as gasoline prices dropped 11.0% (+18.4% y/y). Home heating oil also fell by 1.1% (+29.0% y/y) along with natural gas prices which fell 4.1% (+25.6% y/y). Residential electric power costs were unchanged after a 3.0% January rise (8.8% y/y).
Intermediate goods prices eased 0.3% after the 1.2% January surge although core intermediate prices continued strong with a 0.5% advance.
Crude goods prices dropped sharply as crude energy prices tumbled 16.2% (+26.0% y/y). In March, the volatility in crude oil prices has left the average about even with last month. Core crude prices rose a sharp 3.3% on the strength of high prices for copper base scrap (59.4% y/y), aluminum scrap (30.3% y/y) and iron & steel scrap (3.9% y/y). During the last thirty years "core" crude prices have been a fair indicator of industrial sector activity with a 48% correlation between the six month change in core crude prices and the change in factory sector industrial production.
Reflections on the Yield Curve and Monetary Policy, remarks by Federal Reserve Board Chairman Ben S. Bernanke can be found here.
| Producer Price Index | Feb | Jan | Y/Y | 2005 | 2004 | 2003 |
|---|---|---|---|---|---|---|
| Finished Goods | -1.4% | 0.2% | 3.8% | 4.9% | 3.6% | 3.2% |
| Core | 0.3% | 0.4% | 1.7% | 2.4% | 1.5% | 0.2% |
| Intermediate Goods | -0.3% | 1.2% | 8.2% | 8.0% | 6.6% | 4.7% |
| Core | 0.5% | 1.0% | 4.8% | 5.5% | 5.7% | 2.0% |
| Crude Goods | -9.2% | -0.5% | 12.8% | 14.6% | 17.5% | 25.1% |
| Core | 3.3% | -0.1% | 11.9% | 4.9% | 26.5% | 12.4% |
by Tom Moeller March 21, 2006
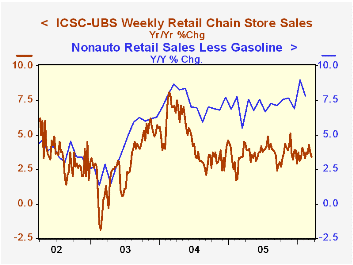
Chain store sales slipped 0.1% lower last week after the prior period's 0.1% up tick, according to the International Council of Shopping Centers (ICSC)-UBS survey.
The average level of sales so far in March is 1.4% ahead of the February average which rose 1.1% from January.
During the last ten years there has been a 47% correlation between the y/y change in chain store sales and the change in nonauto retail sales less gasoline.
The leading indicator of chain store sales slipped 0.3% and in March is a scant 0.1% ahead of February.The ICSC-UBS retail chain-store sales index is constructed using the same-store sales (stores open for one year) reported by 78 stores of seven retailers: Dayton Hudson, Federated, Kmart, May, J.C. Penney, Sears and Wal-Mart.
| ICSC-UBS (SA, 1977=100) | 03/18/06 | 03/11/06 | Y/Y | 2005 | 2004 | 2003 |
|---|---|---|---|---|---|---|
| Total Weekly Chain Store Sales | 470.0 | 470.5 | 3.4% | 3.6% | 4.7% | 2.9% |
by Louise Curley March 21, 2006
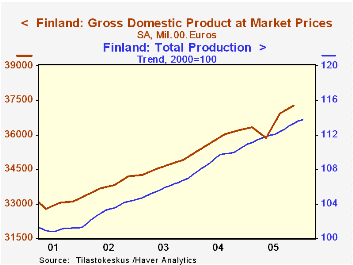
Indicators released today are pointing to an increase in the rate of growth of Finland's GDP in the first quarter from the 0.91% rate of the fourth quarter of 2005. The trend of the monthly total production series, which is a good indicator of Finland's Gross Domestic Product increased 0.18% in January from December and 2.61% from January, 2005. The first chart plots the monthly index of total production with the quarterly values of real GDP to show the leading characteristic of the monthly series. To show that the total production index is a good indicator of GDP, we have aggregated the monthly series quarterly and compared it with the quarterly GDP data as shown in the second chart. The correlation between the two series is .99.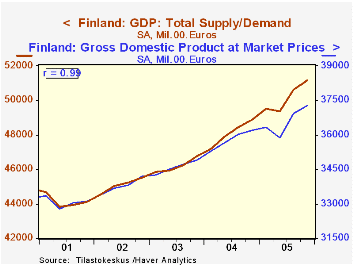
Another sign of increased activity in the first quarter is the rising trend of employment. In Finland, many series, the total production series noted above and some of the labor force data, are reported on seasonally adjusted basis. Instead of computing seasonally adjusted data, Finland computes trends of the unadjusted data. The third chart shows the trend and seasonally unadjusted data for employment. The trend continues to rise in January and February.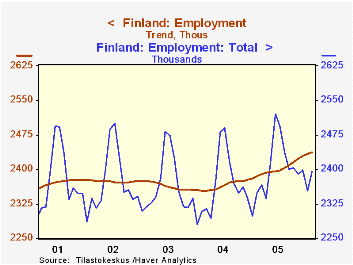
| Finland | Jan 06 | Dec 05 | Jan 05 | M/M % | Y/Y % | 2005 | 2004 | 2003 |
|---|---|---|---|---|---|---|---|---|
| TOTAL PRODUCTION (2000=100) | ||||||||
| Seasonally Unadjusted | 108.6 | 115.7 | 105.1 | -6.14 | 3.33 | 111.9 | 109.6 | 105.8 |
| Trend | 113.8 | 113.6 | 110.9 | 0.18 | 2.61 | 112.1 | 109.2 | 105.7 |
| Feb 06 | Jan 06 | Feb 05 | M/M % | Y/Y % | 2005 | 2004 | 2003 | |
| EMPLOYMENT (000) | ||||||||
| Seasonally Unadjusted | 2395 | 2353 | 2348 | 1.78 | 2.00 | 2401 | 2365 | 2365 |
| Trend | 2436 | 2433 | 2385 | 0.12 | 2.14 | 2401 | 2364 | 2366 |

Tom Moeller
AuthorMore in Author Profile »Prior to joining Haver Analytics in 2000, Mr. Moeller worked as the Economist at Chancellor Capital Management from 1985 to 1999. There, he developed comprehensive economic forecasts and interpreted economic data for equity and fixed income portfolio managers. Also at Chancellor, Mr. Moeller worked as an equity analyst and was responsible for researching and rating companies in the economically sensitive automobile and housing industries for investment in Chancellor’s equity portfolio. Prior to joining Chancellor, Mr. Moeller was an Economist at Citibank from 1979 to 1984. He also analyzed pricing behavior in the metals industry for the Council on Wage and Price Stability in Washington, D.C. In 1999, Mr. Moeller received the award for most accurate forecast from the Forecasters' Club of New York. From 1990 to 1992 he was President of the New York Association for Business Economists. Mr. Moeller earned an M.B.A. in Finance from Fordham University, where he graduated in 1987. He holds a Bachelor of Arts in Economics from George Washington University.
More Economy in Brief


