 Global| Sep 19 2006
PPI Up 0.1%, Core Prices Fell
by:Tom Moeller
|in:Economy in Brief
Summary
The finished goods producer price index increased 0.1% in August, the same as in July and below Consensus expectations for a 0.2% rise.Excluding food & energy finished producer prices were similarly under control last month and [...]
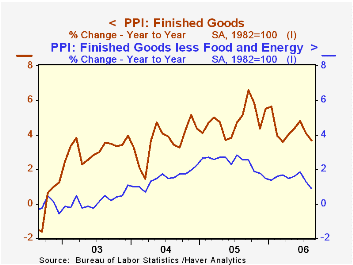
The finished goods producer price index increased 0.1% in August, the same as in July and below Consensus expectations for a 0.2% rise.Excluding food & energy finished producer prices were similarly under control last month and unexpectedly fell 0.4% after a 0.3% drop in July. Expectations had been for a 0.2% increase in the core PPI.
Finished consumer goods prices less food & energy dropped 0.5% (+0.7% y/y) as passenger car prices dropped 2.6% (-5.4% y/y). Capital equipment prices also fell by 0.3% (+1.0% y/y) for the second consecutive monthly decline as light truck prices fell 3.4% (-7.5% y/y). Prices of pumps, compressors & equipment were, however, strong and posted a 0.6% (3.7% y/y) increase.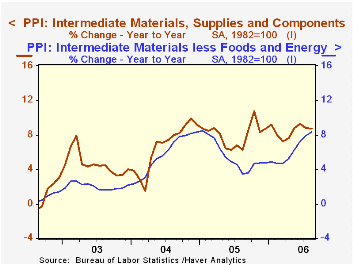
Finished energy goods prices posted a 0.3% (13.1% y/y) August gain as . residential natural gas prices rose 1.6% (5.2% y/y) and residential electric power costs increased 1.3% (7.4% y/y). Gasoline prices fell 2.2% (+20.9% y/y) though fuel oil prices rose 0.7% (25.1% y/y).
Intermediate goods prices posted another strong increase and rose 0.4%. The gain reflected a like 0.4% rise in prices less food & energy.
The crude materials PPI again was strong posting a 2.2% increase led by a 15.7% (NSA, -9.2% y/y) gain in natural gas. Less food & energy crude goods prices fell 2.8% led lower by a 14.7% (+20.1% y/y) drop in iron & steel scrap prices. Aluminum base scrap prices also were weak last month and fell 4.6% (+30.1% y/y).
The Internationalization of the Dollar and Trade Balance Adjustment from the Federal Reserve Bank of New York is available here.
| Producer Price Index | August | July | Y/Y | 2005 | 2004 | 2003 |
|---|---|---|---|---|---|---|
| Finished Goods | 0.1% | 0.1% | 3.6% | 4.9% | 3.6% | 3.2% |
| Core | -0.4% | -0.3% | 0.9% | 2.4% | 1.5% | 0.2% |
| Intermediate Goods | 0.4% | 0.5% | 8.7% | 8.0% | 6.6% | 4.7% |
| Core | 0.4% | 0.7% | 8.3% | 5.5% | 5.7% | 2.0% |
| Crude Goods | 2.2% | 3.1% | 5.4% | 14.6% | 17.5% | 25.1% |
| Core | -2.8% | 1.3% | 25.2% | 4.8% | 26.5% | 12.4% |

Tom Moeller
AuthorMore in Author Profile »Prior to joining Haver Analytics in 2000, Mr. Moeller worked as the Economist at Chancellor Capital Management from 1985 to 1999. There, he developed comprehensive economic forecasts and interpreted economic data for equity and fixed income portfolio managers. Also at Chancellor, Mr. Moeller worked as an equity analyst and was responsible for researching and rating companies in the economically sensitive automobile and housing industries for investment in Chancellor’s equity portfolio. Prior to joining Chancellor, Mr. Moeller was an Economist at Citibank from 1979 to 1984. He also analyzed pricing behavior in the metals industry for the Council on Wage and Price Stability in Washington, D.C. In 1999, Mr. Moeller received the award for most accurate forecast from the Forecasters' Club of New York. From 1990 to 1992 he was President of the New York Association for Business Economists. Mr. Moeller earned an M.B.A. in Finance from Fordham University, where he graduated in 1987. He holds a Bachelor of Arts in Economics from George Washington University.
More Economy in Brief


