 Global| Apr 18 2006
PPI Moderate, As Expected
by:Tom Moeller
|in:Economy in Brief
Summary
The finished goods producer price index for March rose a moderate 0.5% following the unrevised 1.4% decline one month earlier. Consensus expectations had been for a 0.4% gain. Less food & energy the PPI (core) also was moderate and [...]
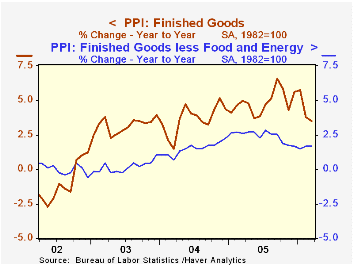
The finished goods producer price index for March rose a moderate 0.5% following the unrevised 1.4% decline one month earlier. Consensus expectations had been for a 0.4% gain.
Less food & energy the PPI (core) also was moderate and increased 0.1%, half the expected rise. Durable consumer goods rose 0.1% (0.5% y/y) for the second consecutive month and nondurables prices continued weak due to declines in apparel prices & textile house furnishings. Prices of all finished consumer goods less food & energy rose 0.2% (1.9% y/y) for the second month and core consumer nondurable goods prices increased 0.2% (2.9% y/y), half the prior month's increase.
Capital equipment prices increased just 0.1% (1.4% y/y) for the second consecutive month.
Finished energy prices during March increased 1.8% (15.6% y/y) as gasoline prices jumped 9.1% (22.2% y/y) but home heating oil fell for the third straight month, down 3.6% (+15.2% y/y) along with natural gas prices which dipped another 0.5% (+22.3% y/y). Residential electric power costs fell 0.7% (+7.9% y/y).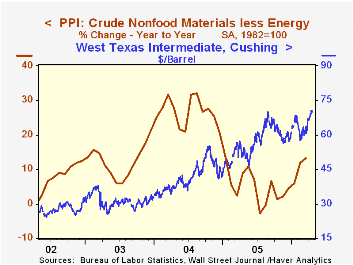
The Short-Term Energy and Summer Fuels Outlook from the US Energy Information Administration can be found here. Also available is the U.S. Energy Prices: Base Case.
Intermediate goods prices fell for the second consecutive month. Core intermediate prices also were tame and rose just 0.1% following the 0.5% surge during February.
Crude goods prices dropped sharply again due to lower energy prices, which fell 4.5%. This month, however, crude oil prices have backed up with the price of WTI crude oil yesterday at $70.41 per barrel versus the March average of $62.90. Core crude prices were strong last month and rose 0.8% due to continued strength in prices for copper base scrap (57.6% y/y), aluminum scrap (25.5% y/y) and iron & steel scrap (10.7% y/y). During the last thirty years "core" crude prices have been a fair indicator of industrial sector activity with a 48% correlation between the six month change in core crude prices and the change in factory sector industrial production.
| Producer Price Index | Mar | Feb | Y/Y | 2005 | 2004 | 2003 |
|---|---|---|---|---|---|---|
| Finished Goods | 0.5% | -1.4% | 3.5% | 4.9% | 3.6% | 3.2% |
| Core | 0.1% | 0.3% | 1.7% | 2.4% | 1.5% | 0.2% |
| Intermediate Goods | -0.1% | -0.3% | 7.0% | 8.0% | 6.6% | 4.7% |
| Core | 0.1% | 0.5% | 4.5% | 5.5% | 5.7% | 2.0% |
| Crude Goods | -2.7% | -9.2% | 4.9% | 14.7% | 17.5% | 25.1% |
| Core | 0.8% | 3.3% | 13.2% | 4.8% | 26.5% | 12.4% |

Tom Moeller
AuthorMore in Author Profile »Prior to joining Haver Analytics in 2000, Mr. Moeller worked as the Economist at Chancellor Capital Management from 1985 to 1999. There, he developed comprehensive economic forecasts and interpreted economic data for equity and fixed income portfolio managers. Also at Chancellor, Mr. Moeller worked as an equity analyst and was responsible for researching and rating companies in the economically sensitive automobile and housing industries for investment in Chancellor’s equity portfolio. Prior to joining Chancellor, Mr. Moeller was an Economist at Citibank from 1979 to 1984. He also analyzed pricing behavior in the metals industry for the Council on Wage and Price Stability in Washington, D.C. In 1999, Mr. Moeller received the award for most accurate forecast from the Forecasters' Club of New York. From 1990 to 1992 he was President of the New York Association for Business Economists. Mr. Moeller earned an M.B.A. in Finance from Fordham University, where he graduated in 1987. He holds a Bachelor of Arts in Economics from George Washington University.


