 Global| Jan 06 2020
PPI Inflation vs. Composite PMI Performance Globally
Summary
The composite PMIs that weight the services and manufacturing sectors to arrive at an overall PMI standing continue to show a great deal of weakness in December. The unweighted average percentile standing for this month's PMIs by [...]
 The composite PMIs that weight the services and manufacturing sectors to arrive at an overall PMI standing continue to show a great deal of weakness in December. The unweighted average percentile standing for this month's PMIs by country and including the EMU is a 29.1 percentile standing. This is close to the JPMorgan Global PMI index at 26.9%. The HSBC emerging markets index showing is much better off with a standing in its 73rd percentile, largely because of India and China. The developed markets index has a very weak 11.5 percentile standing (weaker only about 11.5% of the time). For the 23 entries in the table from Kenya to the U.S. ISM index at the top, there are only seven indexes with standings above their respective historic medians (above 50% on their queue % gauge). Growth, as assessed by the PMIs, clearly remains sub-par.
The JPMorgan Global PMI shows some slight gains month-to-month from October to November and November to December. But looking at three-month vs. six-month vs. 12-month averages, there is no pick up in sight. Emerging markets do show some very slight improvement on both those timelines. Developed countries show deterioration over the sequential averages but also show some slight improvement over recent adjacent months.
None of that is especially convincing as a stand-in for 'good news.'
Looking at country level data, there are still about half or more that in a simple count basis that show deterioration month-over-month or on the sequential averages from 12-months to three-months. However, outright declines (composite PMI values below 50) range from a count of only 3 for the 12-month average to a count of 10 over the three-month average; a clear worsening trend, but still, proportionately an amount in the minority.
Since these are economic entities of varying degrees of importance the performance of the weighted sector indexes at the table below give the best picture of how events are evolving. But the unweighted country-level responses also are significant and meaningful and for more than just local color. The percentile standing column is especially important for revealing how truly weak some of these conditions are compared to where they have been. And the chart on the euro area gives a clear picture of both sectors for the EMU still trying to shake off the weakness. There, the services sector has made a bit more progress but still not out of the woods while manufacturing continues to struggle.
Moreover, the queue % column in the table (percentile standing data) rank the current observations on timeline from January 2015 and on that period there has been generally weak results so that a high standing on this timeline is not the bill of health a high standing might seem to imply. For example, India at a 53.7 diffusion value in December has an 86.5 percentile standing because it has been so weak over the past five years. By comparison, at 53.2, only slightly weaker, the U.S. standing is only in its 7.7 percentile. China, at a low diffusion reading of 52.6, has a 53.8 percentile standing on its timeline. The percentiles are relative gauges and as such they show a lot of weakness, but the raw diffusion gauges also are weak. The emerging markets index at 52.2 has a 73rd percentile standing, for example. The emerging markets are not doing all that well, just better compared to their recent past.
The rankings and the diffusion values all are put in the table to try to better evaluate growth. Clearly, the current evolution is slow and shows only the barest trend of stabilizing or of regaining momentum.
Forecasts for the year ahead embrace assumptions about how much impact will come from the U.S.-China Phase-One deal that still leaves so many tariffs in place. Brexit will bring more clarity to that relationship but probably also dislocation. And then there is the geopolitical scene that is not starting out on the right foot and where there are other shoes left to drop and some are still barely dangling.
Against this backdrop, central bankers have already shifted their stance. Sweden fled the NIRP environment (Negative Interest Rate Policy). The Germans made Christine Lagarde promise to revisit the benefits of the NIRP in the EMU as a condition for approving her to head the ECB. At the Fed, we can see that while policy expects to even keel for a while, policy makers are wary of the impact of such low interest rates on financial stability even as they admit that the risks may still be 'to the downside.' But policy cannot address two things in the opposite direction- so what will the Fed choose to do? What will the ECB do? Are central bankers lusting in their own hearts after higher rates even as they give the lips service of even keeling?
 As we wonder about central bankers, we have Brent and WTI oil prices pushing higher on fears of more dislocation in the Middle East as Iran revisits its Great Satan heritage. The chart (price level vs. price changes) reminds us that oil prices do drive changes in the EMU PPI.
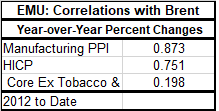 However, when we look at the correlation beyond the PPI to the important policy inflation gauge, the HICP, the correction drops from 0.87 to 0.75. When we look at the impact on the core HICP also excluding tobacco and alcohol, it drops to about 0.2.
What all that means is that if oil prices hold to their higher level and price effects flow through to the principal price indexes as they normally do, there will be more inflation in the various headline indices but not so much in the core. The question will be then which indices the policymakers wish to look at. And as we wizened and jaded market-watchers know they will choose to look at the gauges that endorse the policies they already have decided they want to implement. Yes, I know that is the backwards way to do things, but it accords with the actual lay of the land.
So on that note and despite the low price correlation to the core of the HICP, and to core measures in the U.S. as well, we can expect central bankers to begin to see the inflation in the headline as a vindication of the notion that rates are better off higher than lower.
As a consequence of that view, I see the year setting up for a policy mistake. Inflation has been so long in coming and policy hawks have so much egg on their face for predicting a return of inflation that never showed up that they will be more than willing to treat headline inflation as the long overdue 'friend' that has been delayed even though it clearly is no 'friend' and on this visit may actually be an imposter. But the opportunity for higher oil prices to prompt policy to a perfect storm of mistakes is undeniable and that for now is where I think the risk lies for 2020.

Robert Brusca
AuthorMore in Author Profile »Robert A. Brusca is Chief Economist of Fact and Opinion Economics, a consulting firm he founded in Manhattan. He has been an economist on Wall Street for over 25 years. He has visited central banking and large institutional clients in over 30 countries in his career as an economist. Mr. Brusca was a Divisional Research Chief at the Federal Reserve Bank of NY (Chief of the International Financial markets Division), a Fed Watcher at Irving Trust and Chief Economist at Nikko Securities International. He is widely quoted and appears in various media. Mr. Brusca holds an MA and Ph.D. in economics from Michigan State University and a BA in Economics from the University of Michigan. His research pursues his strong interests in non aligned policy economics as well as international economics. FAO Economics’ research targets investors to assist them in making better investment decisions in stocks, bonds and in a variety of international assets. The company does not manage money and has no conflicts in giving economic advice.
More Economy in Brief


