 Global| May 17 2005
PPI Gains Broad
by:Tom Moeller
|in:Economy in Brief
Summary
The Producer Price Index for finished goods rose 0.6% last month and again surpassed Consensus expectations which had been for a 0.4% increase. Excluding food & energy the PPI rose 0.3% in April, up sharply from the 0.1% gains during [...]

The Producer Price Index for finished goods rose 0.6% last month and again surpassed Consensus expectations which had been for a 0.4% increase. Excluding food & energy the PPI rose 0.3% in April, up sharply from the 0.1% gains during the prior two month's and also beat Consensus expectations for a 0.2% increase.
Prices for finished consumer goods less food & energy rose 0.2% (2.6% y/y), up from a 0.1% increase in March. Consumer durable goods prices increased 0.3% (1.9% y/y) following two months of decline as household appliance prices rose (2.0% y/y) along with furniture prices (3.8% y/y).
Capital goods prices increased for the second month (2.8% y/y) though computer prices continued to fall (-18.7% y/y) as did prices for light trucks (-0.5% y/y).
Finished energy prices jumped for the third consecutive month. The 2.1% (15.7% y/y) increase was led by higher prices for gasoline (28.9% y/y) and fuel oil (51.1% y/y). Finished food prices ticked up 0.1% (2.5% y/y) last month.
Intermediate goods prices again were strong, posting a 0.8% advance which reflected a 3.4% (18.8% y/y) spike in energy prices but the 0.2% monthly increase in core intermediate prices was the most moderate since 2003.
Crude prices surged another 2.7% again on the strength of energy prices, up 7.2% (32.6% y/y). The 0.8% gain in core crude prices was the second month of strength and reflected a 17.1% y/y gain in copper scrap, an 8.3% y/y increase in aluminum scrap and a 4.3% y/y rise in iron & steel scrap. During the last thirty years "core" crude prices have been a fair indicator of industrial sector activity with a 48% correlation between the six month change in core crude prices and the change in factory sector industrial production.
| Producer Price Index | April | March | Y/Y | 2004 | 2003 | 2002 |
|---|---|---|---|---|---|---|
| Finished Goods | 0.6% | 0.7% | 4.8% | 3.6% | 3.2% | -1.3% |
| Core | 0.3% | 0.1% | 2.6% | 1.5% | 0.2% | 0.1% |
| Intermediate Goods | 0.8% | 1.0% | 8.2% | 6.6% | 4.6% | -1.5% |
| Core | 0.2% | 0.3% | 6.6% | 5.7% | 2.0% | -0.5% |
| Crude Goods | 2.7% | 4.3% | 11.8% | 17.5% | 25.1% | -10.6% |
| Core | 0.8% | 1.0% | 8.4% | 26.6% | 12.4% | 3.8% |
by Tom Moeller May 17, 2005
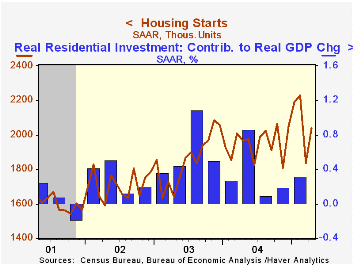
Housing starts rebounded 11.0% in April and recovered about half of the prior month's unrevised 17.6% decline.The rise to 2.038M exceeded Consensus expectations for 1.97M starts. Figures were revised back to 2003.
Single-family starts gained back just a piece of the prior month's sharp decline with a 6.3% m/m rise. All of the rise was due to a 21.1% (11.4% y/y) increase in the South while single family starts in the Northeast dropped for the third month this year (-12.9% y/y). Single family starts in the Midwest fell 7.6% (-19.1% y/y) and starts in the West were off 4.7% but still up 1.0% y/y.
Multi family starts gained back most of the prior moth's skid with a 35.2% rise.
Building permits rose 5.3%. This first increase in three months was nearly back to the record high.
| Housing Starts (000s, AR) | April | March | Y/Y | 2004 | 2003 | 2002 |
|---|---|---|---|---|---|---|
| Total | 2,038 | 1,836 | 3.6% | 1,950 | 1,854 | 1,7 10 |
| Single-family | 1,635 | 1,538 | 0.7% | 1,604 | 1,505 | 1,363 |
| Multi-family | 403 | 298 | 17.3% | 345 | 349 | 347 |
| Building Permits | 2,129 | 2,021 | 2.9% | 2,058 | 1,8 88 | 1,749 |
by Tom Moeller May 17, 2005
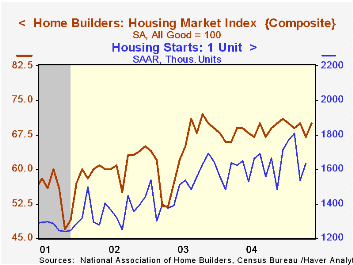
The May National Association of Home Builders' (NAHB) Composite Housing Market Index recovered all of the prior month's sharp drop and rose to 70.
During the last twenty years, annual changes in the composite index had an 83% correlation with the change in new home sales. There's been an 86% correlation with the change in single family housing starts.
All of the index components improved in May though the index of expected sales in six months by just 1.3%.
Traffic of prospective home buyers rose to the highest level this year.
The NAHB index is a diffusion index based on a survey of builders. Readings above 50 signal that more builders view conditions as good than poor.
Visit the National Association of Home Builders.
| Nat'l Association of Home Builders | May | April | May '04 | 2004 | 2003 | 2002 |
|---|---|---|---|---|---|---|
| Composite Housing Market Index | 70 | 67 | 69 | 68 | 64 | 61 |
by Tom Moeller May 17, 2005
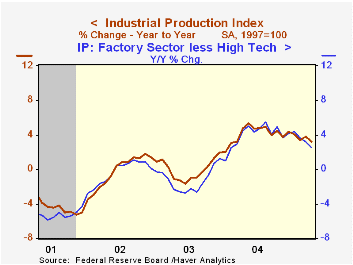
Industrial production fell 0.2% in April following a downwardly revised 0.1% increase in March. Consensus expectations had been for a 0.2% gain. Lower utility output accounted for all of the decline as it fell 2.3% (0.7% y/y) for the third decline this year.
Factory sector output recovered 0.1% (3.5% y/y) of a downwardly revised 0.3% decline in March. Excluding the high tech sector where output rose 1.8% (20.3% y/y) factory output fell for the second month, down 0.1% (+2.5% y/y). During 2004 factory output less high tech rose 3.9%.
Production of electrical equipment, appliances & components rose 0.2% after a downwardly revised 1.0% March increase, but the y/y gain of 2.0% was well off the 6.2% pace of 2004. Machinery output also rose a firm 1.3% but here as well the y/y growth of 6.3% is about last year's increase.
Total capacity utilization slipped to 79.2% and capacity grew 1.2% y/y. Factory sector utilization also slipped to 77.9% and capacity rose 1.3% y/y.
| Production & Capacity | April | March | Y/Y | 2004 | 2003 | 2002 |
|---|---|---|---|---|---|---|
| Industrial Production | -0.2% | 0.1% | 3.1% | 4.1% | -0.0% | -0.3% |
| Consumer Goods | -0.9% | -0.2% | 1.4% | 2.7% | 0.3% | 1.4% |
| Business Equipment | 0.8% | -0.1% | 8.4% | 9.5% | 1.2% | -7.9% |
| Capacity Utilization | 79.2% | 79.4% | 77.7% (04/04) | 78.1% | 75.5% | 75.3% |
by Tom Moeller May 17, 2005
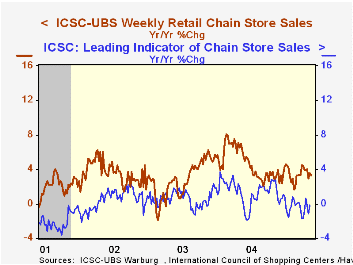
Chain store sales fell a sharp 1.0% last week following the 0.7% surge which opened the month of May, according to the International Council of Shopping Centers (ICSC)-UBS survey. Sales in May nevertheless remained 0.9% above the April average which rose 0.6% from March.
During the last ten years there has been a 56% correlation between the y/y change in chain store sales and the change in non-auto retail sales less gasoline, as published by the US Census Department. Chain store sales correspond directly with roughly 14% of non-auto retail sales less gasoline.
The leading indicator of chain store sales from ICSC rose 0.4% (-0.1% y/y) in early May and reversed all of the prior week's decline.
The ICSC-UBS retail chain-store sales index is constructed using the same-store sales (stores open for one year) reported by 78 stores of seven retailers: Dayton Hudson, Federated, Kmart, May, J.C. Penney, Sears and Wal-Mart.
| ICSC-UBS (SA, 1977=100) | 05/14/05 | 05/07/05 | Y/Y | 2004 | 2003 | 2002 |
|---|---|---|---|---|---|---|
| Total Weekly Chain Store Sales | 456.7 | 461.4 | 3.3% | 4.6% | 2.9% | 3.6% |
by Louise Curley May 17, 2005
The first quarter preliminary report for Japan's Real Gross Domestic Product released today was surprisingly good. GDP increased at annual rate of 5.3%. Last year also started out with a bang--a slightly larger increase, 5.6%-- but this was followed by declines of 0.83% and 1.04% in the second and third quarters and a minimal increase of 0.06% in the fourth quarter.
The composition of this year's first quarter increase is significantly different from that of last year's (See table below) and suggests that the outlook may be more promising. Although private inventory accumulation accounted for almost one-third of the increases in both years, there were encouraging shifts from the public to the private sector in the remaining two-thirds of the increase. Household consumption accounted for 49% of the total increase in 2005, up from 27.1% in 2004, while government consumption went from 17.2% to 10.1%. Private gross fixed investment accounted for 8.2% of the increase in the first quarter of 2005 in contrast to a negative impact of 26.6% in 2004, while public gross fixed investment dropped to 5.8% from a 33.3% contribution in 2004.
These increases in the private domestic sector's contribution to growth were all the more impressive in view of negative impact of the external sector. Net exports of goods and services were a drag on growth in 2005 of almost 6% whereas they contributed 19% to growth in 2004.
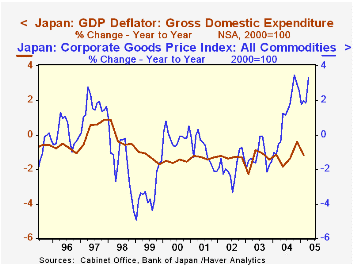
While the increase in activity in the private domestic sector is encouraging, deflation remains a stubborn problem. The non seasonally adjusted chain-linked GDP deflator in the first quarter of 2005 was 1.2% below the comparable figure of a year ago. There is, however, some evidence that prices at the wholesale level are beginning to move up and may eventually lead to price rises at the consumer level. Japan's Corporate Goods Price Index released yesterday, showed a year to year increase of 3.3% in April. The index has shown increases since May of 2004, the first sustained rise since the late nineties. The attached chart shows the year-to-year changes in this index together with the year-to-year changes in the chain linked GDP deflator.
| Fourth to First Quarter Change | 2005 Bil. Yen | 2004 Bil. Yen | 2005 % | 2004 % |
|---|---|---|---|---|
| Household Consumption | 3416.0 | 1958.2 | 49.2 | 27.1 |
| Government Consumption | 699.9 | 1250.5 | 10.1 | 17.2 |
| Private Gross Fixed Invest. | 51.2 | -1.957.7 | 8.2 | -26.6 |
| Public Gross Fixed Invest. | 404.8 | 2432.1 | 5.8 | 33.3 |
| Private Inventory Change | 2312.0 | 2207.6 | 33.3 | 30.4 |
| Public Inventory Change | -48.9 | 68.4 | -0.7 | 0.9 |
| Net Exports of Goods and Services | -412.4 | 1389.0 | -5.9 | 19.1 |
| Total of Items Listed* | 6942.6 | 7348.1 | 100.0 | 100.0 |
| Change in GDP | 6950.2 | 7267.6 |

Tom Moeller
AuthorMore in Author Profile »Prior to joining Haver Analytics in 2000, Mr. Moeller worked as the Economist at Chancellor Capital Management from 1985 to 1999. There, he developed comprehensive economic forecasts and interpreted economic data for equity and fixed income portfolio managers. Also at Chancellor, Mr. Moeller worked as an equity analyst and was responsible for researching and rating companies in the economically sensitive automobile and housing industries for investment in Chancellor’s equity portfolio. Prior to joining Chancellor, Mr. Moeller was an Economist at Citibank from 1979 to 1984. He also analyzed pricing behavior in the metals industry for the Council on Wage and Price Stability in Washington, D.C. In 1999, Mr. Moeller received the award for most accurate forecast from the Forecasters' Club of New York. From 1990 to 1992 he was President of the New York Association for Business Economists. Mr. Moeller earned an M.B.A. in Finance from Fordham University, where he graduated in 1987. He holds a Bachelor of Arts in Economics from George Washington University.
More Economy in Brief


