 Global| Jan 20 2010
PPI Core Behaves; Headline IsStill Unruly
Summary
On the month the PPI was a “what-me-worry’ sort of report. A headline gain of 0.2%, the core flat, the core for consumer goods up a scant 0.1%:. No problem. Still Yr/Yr the PPI headline is up by 4.7% -and it is accelerating its rise [...]
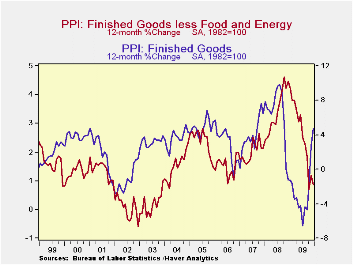
On the month the PPI was a “what-me-worry’ sort of report. A headline gain of 0.2%, the core flat, the core for consumer goods up a scant 0.1%:. No problem. Still Yr/Yr the PPI headline is up by 4.7% -and it is accelerating its rise over shorter periods. But the core is complacent rising by 0.9% over 12-months and the consumer core is up by 1.6%. Moreover, the consumer core and overall Core PPI are both still decelerating.
The PPI is not the Fed’s preferred inflation gauge. Still it is good to see that core inflation is not percolating. If we look at the correlation between the core PPI for consumer goods and the core CPI for goods we find an R-squared relationship of 0.15, very low. The PPI is less important that the CPI and it does not track the CPI either.
The Fed emphasizes core inflation at the CPI level and for good reason. While other central banks look at the headline rate and the while that focus made the Fed (and economists) the butt of jokes as oil prices soared in 2008, history confirms the good judgment in emphasizing core inflation. Food and energy prices are volatile. When you include them in the headline you get exaggerated results when food and energy prices move. If they advance inflation is measured as too high; if they recede inflation is measured as too low. The core is the best shot we have at getting to true ongoing inflation. In 2008 when headline inflation flared the core was relatively quiescent encouraging the Fed to not over do it with worry. In fact central banks that targeted headline inflation were stuck in 2008 and 2009 since they had to cut rates with inflation still way over their targets and then make excuses. Core targeting would have made more sense.
In any event the PPI is not a source of worry. The year over year rate is still accelerating as the core rate is still decelerating. Energy and food prices each have accelerated but recently oil is looking a bit more like its movements may be capped. If so the core reading once again will hold sway on the outlook for inflation. It was inevitable that headline inflation would rise as oil prices rebounded in a global recovery. But oil has mostly come back up to where it belongs and from now on it is less clear that oil is going to be fueling a further rise in the headline.
For now we think the Fed is perfectly satisfied with inflation’s performance and prospects. Inflation expectations are for the most part still well contained. Today’s PPI report was as expected an economic non-event.
| Key Trends In Producer Prices | |||||
|---|---|---|---|---|---|
| Dec-09 | PPI Trends By Type Of Good | ||||
| PPI | 1Mo:M/M | 3-Mo:ar | 6-Mo:ar | 1-Yr | Yr-Ago |
| Total PPI | 0.2% | 9.5% | 5.0% | 4.7% | -1.2% |
| Finished Consumer Gds | 0.3% | 13.5% | 7.1% | 6.5% | -2.9% |
| Consumer Foods | 1.4% | 15.0% | 4.5% | 1.1% | 3.4% |
| Finished C Gds Excl Foods | -0.2% | 12.9% | 7.9% | 8.3% | -5.4% |
| Nondurables less Food | -0.1% | 19.6% | 12.0% | 11.5% | -8.7% |
| ConsNonDurxF&E | 0.2% | 3.4% | 2.5% | 2.5% | 5.5% |
| Durable Goods | -0.1% | -3.0% | -2.3% | 0.3% | 3.5% |
| Finished Core Cons Gds | 0.1% | 0.4% | 0.3% | 1.6% | 4.6% |
| Capital Goods | -0.1% | -1.5% | -0.8% | 0.0% | 4.3% |
| MFG Industries | -0.1% | -1.0% | -0.3% | -0.3% | 4.0% |
| NonMFG Industries | 0.0% | -1.5% | -0.8% | 0.1% | 4.4% |
| Core PPI | 0.0% | -0.5% | -0.1% | 0.9% | 4.5% |
| Memo: Finished Energy | -0.4% | 36.6% | 21.5% | 21.2% | -21.2% |
by Robert Brusca January 20, 2010
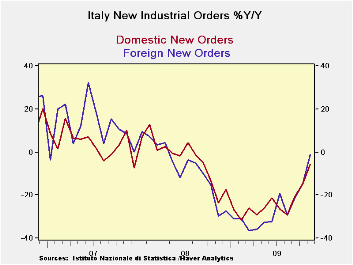
Italian orders surged beyond expectations in November rising by 2.6%, marking three straight months of increases and increases in seven of the last eight months. These statistics register in the sequential growth rates in the table above as Italy’s orders growth is posting progressively higher rates of growth over shorter periods of time. This is a sign of acceleration in action. While foreign orders are leading the way Italy’s domestic orders have been surprisingly strong, especially over the past three months.
As impressive as these results are they are distorted to some extent by having that one drop in the past seven months (coming four months ago) as an outsized drop of nearly 9%. Foreign orders still have not gotten back to their July 2009 peak levels and have fallen in two of the past four months.
Surprisingly, domestic orders have just moved beyond their July level with this report and seemingly are gaining momentum. The sequential growth rates exaggerate a bit the strength of the rebound, yet the transition to a better industrial sector seems to be real.
In an economy that had fiscal excesses prior to the financial crisis and was not able to mount the stimulus that some other countries did, Italy’s performance is impressive. It is also impressive that at a time that other economies are struggling mightily, Greece with debt, Spain with real estate and Iceland with responsibility, Italy, a favorite target of speculators, has been able to mount a very good looking recovery.
Business confidence is still somewhat circumspect as is consumer confidence, but all-in-all, the industrial rebound is looking especially sound in November, coming at a time when others have been foundering. Germany’s orders did snap back partially in November after an October set back and France has had two declines in orders in a row in October and November.
There are no new initiatives to account for Italy’s improvement. For the time being we can welcome the progress while at the same time being somewhat skeptical of this progress in the face of difficulties elsewhere.
| Italy Orders | ||||||
|---|---|---|---|---|---|---|
| Saar exept m/m | Nov-09 | Oct-09 | Sep-09 | 3-mo | 6-mo | 12-mo |
| Total | 2.6% | 0.6% | 6.0% | 42.9% | 11.9% | -4.1% |
| Foreign | 2.8% | -0.1% | 8.1% | 51.9% | 25.3% | -1.1% |
| Domestic | 2.4% | 1.0% | 4.7% | 38.0% | 5.9% | -5.6% |
| Memo | ||||||
| Sales | 1.5% | -1.6% | 2.4% | 9.4% | 1.5% | -9.7% |
by Robert Brusca January 20, 2010
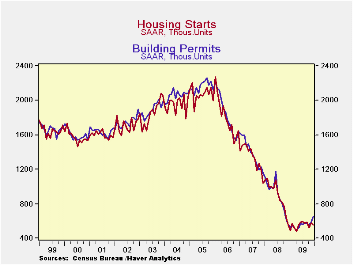
Housing starts unwound in December falling by 4% on the month. Still, the drop leaves starts in a more less stabilized environment, bumping along at one of their lowest levels of the cycle. Single unit 2-4 unit and 5-unit starts are all down by some 75% to 89% from their max readings of the cycle. At the same time they are up 27% to 125% from their respective cycle lows (with the small 2-4 unit category responsible for the strong-seeming end of the range). Starts are lower across these groupings over most horizons from 3-months to 6-months to 12-months.
Starts fell in December in three of four regions, the South being the exception. The West saw a relatively small drop of 0.9% in December while the Northeast saw starts drop by 19% and the Midwest by 18.5%. The clustering of weakness in the Northeast and Midwest suggests that weather played a role as snow storms swept though the country in December on a fairly intense basis.
By regions starts are off from their respective cycle peaks ranging from a low of 71% in the South to a high of 81% in the West. The weakness has been quite uniform across the country.
One encouraging factor is that permits rose in December and did so across all four regions. While starts fell by 4% nationwide, permits rose by 10.9%.
Housing affordability remained quite good despite some minor upticks in mortgage rates. Despite the winter weather the report continues to show signs of bottoming and promise of some rebound for the months ahead as permits show steady positive momentum across all key time horizons from three- months to six months to 12-months.
| Housing Starts/Permits By Region | ||||||||
|---|---|---|---|---|---|---|---|---|
| Housing Starts: Analytical Comparisons (Pct. Changes Not Compounded) | ||||||||
| Dec.2009 | ||||||||
| Northeast | Midwest | South | West | |||||
| In 000's of Units | Starts | Permits | Starts | Permits | Starts | Permits | Starts | Permits |
| This Month:Saar | 51 | 87 | 88 | 116 | 310 | 319 | 108 | 131 |
| Nov.2009 | 63 | 68 | 108 | 105 | 300 | 305 | 109 | 111 |
| Oct.2009 | 54 | 64 | 99 | 104 | 265 | 272 | 106 | 111 |
| 3-month avg. | 56 | 73 | 98 | 108 | 292 | 299 | 108 | 118 |
| 1-mo. hg. | -19.0% | 27.9% | -18.5% | 10.5% | 3.3% | 4.6% | -0.9% | 18.0% |
| 3-month hg | -22.7% | 35.9% | -15.4% | 17.2% | 4.0% | 9.2% | -8.5% | 9.2% |
| 6-month hg | -37.0% | 50.0% | -17.8% | 26.1% | 12.3% | 4.6% | -14.3% | 13.9% |
| yr/yr hg. | -19.0% | 45.0% | 15.8% | 36.5% | 9.5% | 5.6% | -19.4% | 12.0% |
| Drop from Max | -79.5% | -71.3% | -80.3% | -71.6% | -72.9% | -71.1% | -81.5% | -78.8% |
| From Cycle Low | 34.2% | 64.2% | 51.7% | 46.8% | 34.2% | 22.7% | 35.0% | 29.7% |

Robert Brusca
AuthorMore in Author Profile »Robert A. Brusca is Chief Economist of Fact and Opinion Economics, a consulting firm he founded in Manhattan. He has been an economist on Wall Street for over 25 years. He has visited central banking and large institutional clients in over 30 countries in his career as an economist. Mr. Brusca was a Divisional Research Chief at the Federal Reserve Bank of NY (Chief of the International Financial markets Division), a Fed Watcher at Irving Trust and Chief Economist at Nikko Securities International. He is widely quoted and appears in various media. Mr. Brusca holds an MA and Ph.D. in economics from Michigan State University and a BA in Economics from the University of Michigan. His research pursues his strong interests in non aligned policy economics as well as international economics. FAO Economics’ research targets investors to assist them in making better investment decisions in stocks, bonds and in a variety of international assets. The company does not manage money and has no conflicts in giving economic advice.
More Economy in Brief


