 Global| Oct 20 2008
Philadelphia Fed Index Lowest Since 2001
by:Tom Moeller
|in:Economy in Brief
Summary
Coincident with the recent turmoil in the financial market, last week the Philadelphia Federal Reserve Bank reported that its October Index of General Business conditions in the manufacturing sector fell to -37.5 its lowest level [...]
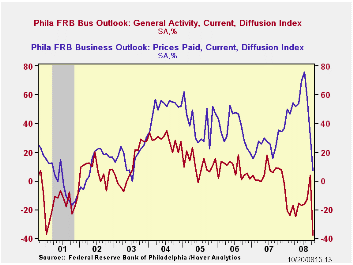
Coincident with the recent turmoil in the financial market, last week the Philadelphia Federal Reserve Bank reported that its October Index of General Business conditions in the manufacturing sector fell to -37.5 its lowest level since 2001. The m/m deterioration in the index from a level of +3.8 in September was a record for the series. A reading of -10 had been expected for this month.
During the last ten years there has been a 61% correlation between the level of the Philadelphia Fed Business Conditions Index and the three-month growth in factory sector industrial production. There has been a 43% correlation with q/q growth in real GDP.
The Philadelphia Fed constructs a diffusion index for total business activity and each of the sub-indexes. The business conditions index reflects a separate survey question.
Amongst the sub-indexes, the new orders index led this month's
weakness with a 36.1 point m/m drop to its lowest level since the
recession of 1990. Unfilled orders fell 17.3 points to the lowest level
since early 1996. The shipments index also fell sharply by 21.4 points
to its lowest level since 2001. 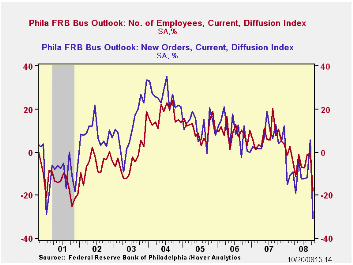
The employment index fell a sharp 17.5 points to the lowest level since the recession year of 2001. Twenty eight percent of respondents expected to reduce employment levels, the highest since 2001, while only 10.2% expected to raise them. During the last ten years there has been a 79% correlation between the index level and the m/m change in manufacturing sector payrolls.
The prices paid index fell out of bed. The 24.3 point drop followed a 26.0 decline during September and left the index level at its lowest since 2003. Month-to-month declines of these magnitudes rival those during the mid-1970s. During the last ten years there has been a 67% correlation between the prices paid index and the three-month growth in the intermediate goods PPI. There has been an 82% correlation with the change in core intermediate goods prices.
The separate index of expected business conditions in six months also fell by the largest amount, m/m, since the 1970s. The expectations index for new orders turned negative for second time this year and for shipments the index was at its lowest since 1979. The expectations index for employment fell 31.7 points to the lowest level since 1990. The expected prices paid figure fell a sharp 27.2 points to its lowest level since 2001.
The latest Business Outlook Survey from the Federal Reserve Bank of Philadelphia can be found here.
The Geography of Research and Development Activity in the U.S. from the Federal Reserve Bank of Philadelphia can be found here.
| Philadelphia Fed (%) | October | September | October '07 | 2007 | 2006 | 2005 |
|---|---|---|---|---|---|---|
| General Activity Index | -37.5 | 3.8 | 6.0 | 5.1 | 8.1 | 11.5 |
| Prices Paid Index | 7.2 | 31.5 | 25.8 | 26.4 | 36.6 | 40.1 |
by Tom Moeller October 20, 2008
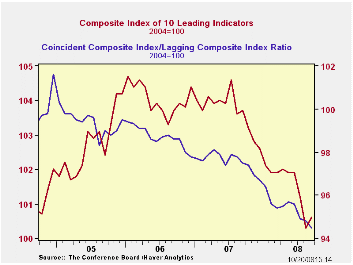
The composite index of leading economic indicators, reported by the Conference Board, increased 0.3% last month. The rise came after a revised August decline of 0.9% which was nearly double that reported initially. Despite the increase, the six-month percent change remained negative at -2.5% which was modestly improved from the low of -4.7% figure last October.
Last month's increase reflected sharp gains in the money supply, consumer expectations, the interest rate yield curve and the vendor performance components. Lower building permits, lower stock prices, higher claims for unemployment insurance and shorter weekly hours worked offset these gains with large negative contributions.
The breadth of one-month increase amongst the leaders' 10
components jumped to 60% but over a six-month period the breadth of
gain amongst the components remained at its cycle low of 20%.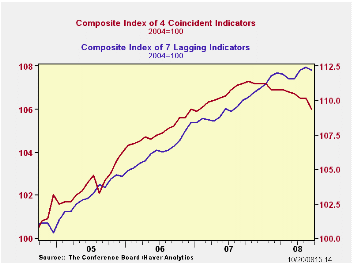
The leading index is based on actual reports for eight economic data series. The Conference Board initially estimates two series, orders for consumer goods and orders for capital goods.
The coincident indicators fell 0.5% after a revised no change during August. Half of the components rose and half fell for the second month, yet over six months only a quarter rose. Over the last ten years there has been an 86% correlation between the y/y changes in the coincident indicators and real GDP.
The lagging index reversed the August increase and fell 0.2% as the average duration of unemployment fell sharply. The ratio of coincident to lagging indicators (a measure of economic excess) fell further to its lowest level since 1982.
Visit the Conference Board's site for coverage of leading indicator series from around the world.
This morning's testimony by Fed Chairman Ben S. Bernanke is available here.
| Business Cycle Indicators (%) | September | August | July | June, 6 Month % (AR) | 2007 | 2006 | 2005 |
|---|---|---|---|---|---|---|---|
| Leading | 0.3 | -0.9 | -0.7 | -2.5 | -0.4% | 1.3% | 2.7% |
| Coincident | -0.5 | 0.0 | -0.2 | -1.7 | 1.7% | 2.4% | 2.5% |
| Lagging | -0.2 | 0.2 | 0.5 | 0.4 | 2.9% | 3.1% | 3.1% |
by Tom Moeller October 20, 2008
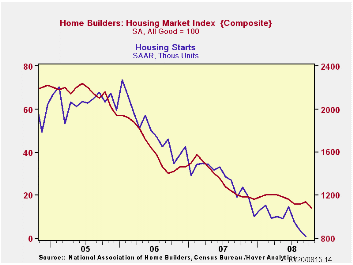
The National Association of Home Builders indicated that its October Housing Market Index (HMI) fell to a record low of 14. The index is compiled from survey questions asking builders to rate market conditions as “good”, “fair”, “poor” or “very high” to “very low”. Numerical equivalent results over 50 indicate a predominance of “good” readings.
Since 1990, the year-to-year change in this index has had a correlation of 72% with the year-to-year percentage change in new single-family home sales. As a result, the latest HMI index at best indicates a bottoming of the housing market's troubles.
The Home Builders Association indicated that its sub-index of present sales conditions also fell to a record low of 14. That was down from last year's average level of 27 and 2006's average of 45.
Builders’ expectations for sales six months also plumbed a new series' low at 19. The “traffic of prospective buyers also fell to a new low.
Each of the country's regions showed deterioration in the index; however, in the South and in the West conditions, fell to new low.
The NAHB has compiled the Housing Market Index since 1985. The results, along with other housing and remodeling indexes from NAHB Economics, are included in Haver’s SURVEYS database.
| Nat'l Association of Home Builders | October | September | October '07 | 2007 | 2006 | 2005 |
|---|---|---|---|---|---|---|
| Composite Housing Market Index | 14 | 17 | 19 | 27 | 42 | 67 |
by Robert Brusca October 20, 2008
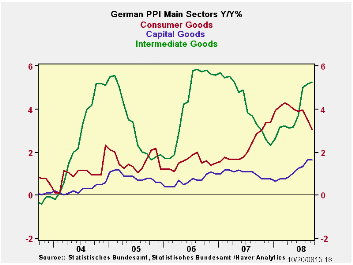
Consumer goods inflation has broken lower in Germany. But for capital goods and intermediate goods, inflation forces are lingering. Headline PPI inflation has spurted by 7.8% over three months, a far cry from the 2% limit on consumer prices. The 0.4% headline PPI rise in prices in September offsets most of the 0.5% decline in August. For ex-energy prices the rise in September was a thin 0.1%. Over three months, however, the inflation rate is a still troubling 4.3% and the sequential growth rates show a ramping up of ex-energy inflation for 12 months to 6 months to 3 months.
Still, Jurgen Stark, a former Bundesbank member and currently an executive of the ECB says that, "We are seeing that due to the weakening in growth and the probability of very flat growth in 2009, the inflation rate will also probably fall somewhat more strongly than we had earlier expected."
Policy makers are looking at inflation and its trends very
differently these days. They are setting performance and trends aside
because oil prices have dropped so suddenly and economic growth has
dimmed so quickly. Apparently, few policymakers give much credence to
the notion that the OPEC meeting this week could re-boost oil prices in
a way to light a new fire under inflation. Central banks have gotten,
instead, to the point of being so worried about (or sure of) coming
economic weakness and its impact on prices that they are losing their
fear of inflation near term. This is very significant especially for a
central bank like the ECB that only has an inflation mandate – no
growth mandate.
| Germany PPI | ||||||||
|---|---|---|---|---|---|---|---|---|
| %m/m | %-SAAR | |||||||
| Sep-08 | Aug-08 | Jul-08 | 3-mo | 6-mo | 12-mo | 12-moY-Ago | IN Q3 | |
| MFG | 0.4% | -0.5% | 2.0% | 7.8% | 10.1% | 8.3% | 1.5% | 11.7% |
| Ex Energy | 0.1% | 0.2% | 0.8% | 4.3% | 3.9% | 3.5% | 2.5% | 5.3% |
by Robert Brusca October 20, 2008
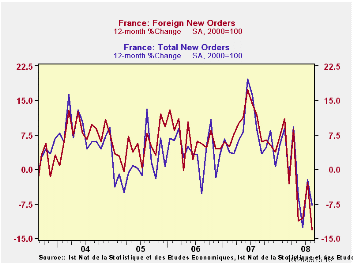
French order performance and trends are clear and are clearly negative. The momentum is not as clearly building a head of steam as in some countries, however. But, on the other hand, all recent views of order trends are lower at some disturbing pace. While the 3-month pace at -6.9% is better than the 6-month pace of -18.5%, the 3-month pace is still negative and the quarter-to-date growth rate is still severe at -7.4%.
But, for France as for Italy and others, the foreign sector is even weaker. For foreign orders we see a 3-month decline at a pace of -5.6% that compares to a -25% pace over 6 months. The quarter-to-date growth rate of -11.5% shows a slightly accelerated negative growth rate compared to the three-month pace and a rate roughly comparable to the Yr/Yr pace of -13.2%.
What these statistics remind us, is that the various economies are seeing withering orders (planned economic activity) and the pace of the disruption to expected activity is still somewhat uneven - but the view remains one of economies that are contracting. Overall, the growth rates are weakened and are worrisome. These are not minor pull-backs nor do they seem to be one-off declines. These are negative growth rates of such magnitude that the persistence of these declines and the threat to overall growth is quite clear. Central banks have gotten the message.
As of today Germany announced it was working on a stimulus package for its economy. This is after it has assembled a bank bailout package. At one time – even a few short weeks ago - Germany insisted that it did not require either.
Things change. And sometimes they change rapidly.
| French Orders | |||||||
|---|---|---|---|---|---|---|---|
| Saar exept m/m | Aug-08 | Jul-08 | Jun-08 | 3-mo | 6-mo | 12-mo | Quarter-2-Date |
| Total | -7.2% | 4.3% | 1.4% | -6.9% | -18.5% | -7.8% | -7.4% |
| Foreign | -7.5% | 3.4% | 3.1% | -5.6% | -25.1% | -13.2% | -11.5% |
by Louise Curley October 20, 2008
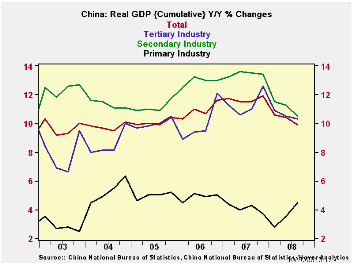
 China's
real Gross Domestic Product in the third quarter of this year, just
released, was 9% over the third quarter of last year. The
increase was below consensus and was the fifth quarter in a row in
which the rate of increase declined, as can be seen in the first
chart. Last year China's economy grew by 11.6%. So
far this year the economy is growing 9.9% over the corresponding period
of 2007. With the outlook for continued slowing of
the economy, the growth for this year as a whole is unlikely to be that
high.
China's
real Gross Domestic Product in the third quarter of this year, just
released, was 9% over the third quarter of last year. The
increase was below consensus and was the fifth quarter in a row in
which the rate of increase declined, as can be seen in the first
chart. Last year China's economy grew by 11.6%. So
far this year the economy is growing 9.9% over the corresponding period
of 2007. With the outlook for continued slowing of
the economy, the growth for this year as a whole is unlikely to be that
high.
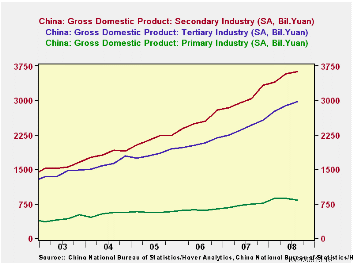
The only sector to show growth increasing this year is the primary sector that includes farming, forestry, animal husbandry and fishing. This is the smallest sector of the economy and the one with the lowest growth rate. The secondary sector that includes mining and quarrying, manufacturing, production and supply of electricity, water and gas, is the largest sector and has experienced the sharpest deceleration in growth in the economy in the current year .
The tertiary sector that includes all industries not included in the primary or secondary sectors, experienced a slightly smaller deceleration in growth. The second chart shows the year to date growth in the total economy and in the three sectors. The third chart shows the relative magnitudes of the three sectors in nominal terms (billions of yuan).
| CHINA | Q3 08 | Q2 08 | Q1 08 | 2007 | 2006 | 2005 |
|---|---|---|---|---|---|---|
| GDP Y/Y % Change | 9.0 | 10.1 | 10.6 | 11.6 | 10.7 | 9.9 |
| GDP (YTD %) | 9.9 | 10.4 | 10.6 | 11.9* | 11.6* | 10.4* |
| Primary Industry (YTD %) | 4.5 | 3.5 | 2.8 | 3.7* | 5.0* | 5.2* |
| Secondary Industry (YTD %) | 10.5 | 11.3 | 11.5 | 13.4* | 13.0* | 11.7* |
| Tertiary Industry (YTD %) | 10.3 | 10.5 | 10.9 | 12.6* | 12.1* | 10.5* |
| Primary Industry (Billion Yuan) | -- | -- | -- | 2891 | 2470 | 2272 |
| Secondary Industry (Billion Yuan) | -- | -- | -- | 12138 | 10200 | 8621 |
| Tertiary Industry (Billion Yuan) | -- | -- | -- | 9633 | 8270 | 7340 |
| *These are Q4 to Q4 changes. | ||||||

Tom Moeller
AuthorMore in Author Profile »Prior to joining Haver Analytics in 2000, Mr. Moeller worked as the Economist at Chancellor Capital Management from 1985 to 1999. There, he developed comprehensive economic forecasts and interpreted economic data for equity and fixed income portfolio managers. Also at Chancellor, Mr. Moeller worked as an equity analyst and was responsible for researching and rating companies in the economically sensitive automobile and housing industries for investment in Chancellor’s equity portfolio. Prior to joining Chancellor, Mr. Moeller was an Economist at Citibank from 1979 to 1984. He also analyzed pricing behavior in the metals industry for the Council on Wage and Price Stability in Washington, D.C. In 1999, Mr. Moeller received the award for most accurate forecast from the Forecasters' Club of New York. From 1990 to 1992 he was President of the New York Association for Business Economists. Mr. Moeller earned an M.B.A. in Finance from Fordham University, where he graduated in 1987. He holds a Bachelor of Arts in Economics from George Washington University.
More Economy in Brief


