 Global| Nov 19 2009
Philadelphia Fed Index Improves ToHighest Since 2007
by:Tom Moeller
|in:Economy in Brief
Summary
The Philadelphia Federal Reserve Bank indicated that the November index of factory sector activity in the region continued to expand this month. Moreover, the index was unexpectedly strong at 16.7 and positive for the fourth [...]
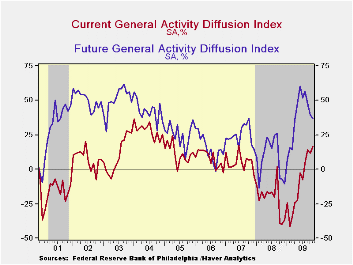 The
Philadelphia Federal Reserve Bank indicated that the November index of
factory sector activity in the region continued to expand this month.
Moreover, the index was unexpectedly strong at 16.7 and positive for
the fourth consecutive month. The latest level compared to figures near
-40.0 this past fall and winter.
The
Philadelphia Federal Reserve Bank indicated that the November index of
factory sector activity in the region continued to expand this month.
Moreover, the index was unexpectedly strong at 16.7 and positive for
the fourth consecutive month. The latest level compared to figures near
-40.0 this past fall and winter.
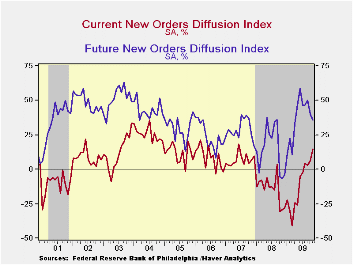
During the last ten years there has been a 77% correlation between the level of the Philadelphia Fed Business Conditions Index and the three-month growth in factory sector industrial production. There has been a 70% correlation with q/q growth in real GDP. The latest survey from the Philadelphia Federal Reserve Bank can be found here.· Amongst the components new orders and shipments each improved to the highest since 2007. Also showing improvement was the employment index which rose to nearly break-even compared with a low of -52.0 during March. During the last ten years there has been a 79% correlation between the index level and the m/m change in manufacturing sector payrolls. The inventory component reversed the October decline and suggests that any turn towards inventory accumulation will be modest.
 A decline
in the prices paid index reversed all of its October
increase. Nevertheless, the positive figure compares to negative
readings this past winter and spring. During the last ten years there
has been a 74% correlation between the prices paid index and the
three-month growth in the intermediate goods PPI. There has been an 83%
correlation with the change in core intermediate goods prices.
A decline
in the prices paid index reversed all of its October
increase. Nevertheless, the positive figure compares to negative
readings this past winter and spring. During the last ten years there
has been a 74% correlation between the prices paid index and the
three-month growth in the intermediate goods PPI. There has been an 83%
correlation with the change in core intermediate goods prices.
Expected business conditions in six months deteriorated for the fifth straight month. The November index fell to a still-positive reading of 36.8 but that was well-off the recent high. Most of the index components, especially orders and shipments, were down sharply.
The figures from the Philadelphia Federal Reserve can be found in Haver's SURVEYS database.
The exchange rate: what's in it for prices? from the Federal Reserve Bank of Philadelphia can be found here.
| Philadelphia Fed (%) | November | October | September | November '08 | 2008 | 2007 | 2006 |
|---|---|---|---|---|---|---|---|
| General Activity Index | 16.7 | 11.5 | 14.1 | -39.8 | -21.3 | 5.0 | 8.0 |
| New Orders | 14.8 | 6.2 | 3.3 | -29.3 | -14.7 | 6.9 | 9.0 |
| Number of Employees | -0.5 | -6.8 | -14.3 | -23.8 | -8.7 | 6.8 | 9.0 |
| Prices Paid Index | 14.9 | 21.3 | 14.9 | -26.6 | 36.4 | 26.3 | 36.7 |
U.S. Weekly Initial Claims Unemployment Insurance Hold Steady Near January Low
by Tom Moeller November 19, 2009
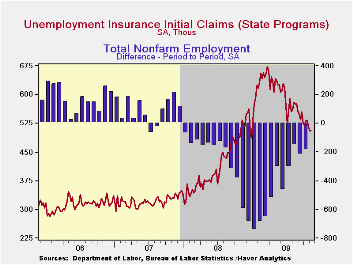 Layoffs from the U.S. workforce held steady last week at the
recent low. That's according to the Labor Department which reported
that initial claims for unemployment insurance equaled the prior week's
upwardly revised level of 505,000. Claims have not been lower since the
first week of January and have fallen sharply from the peak reached in
March of 674,000 claims. The four-week moving average of claims fell to
514,000 and the latest weekly figure about matched Consensus
expectations.
Layoffs from the U.S. workforce held steady last week at the
recent low. That's according to the Labor Department which reported
that initial claims for unemployment insurance equaled the prior week's
upwardly revised level of 505,000. Claims have not been lower since the
first week of January and have fallen sharply from the peak reached in
March of 674,000 claims. The four-week moving average of claims fell to
514,000 and the latest weekly figure about matched Consensus
expectations.
The latest figure covers the survey week for November nonfarm
payrolls and claims fell 26,000 (4.9%) from the October period. During
the last ten years there has been a negative 85% correlation between
level of initial claims for jobless insurance the m/m change in nonfarm
payrolls.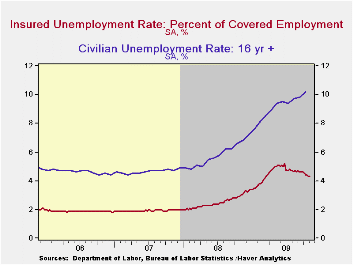
Continuing claims for unemployment insurance during the latest week fell 39,000 to their lowest level since mid-March. The decline reflects the improved job market but may also be a function of the exhaustion of benefits. Continuing claims provide an indication of workers' ability to find employment. The four-week average of continuing claims fell modestly to 5,711,500 and have fallen 18.7% from their late-June peak. This series dates back to 1966.
Extended benefits for unemployment insurance rose fell modestly w/w but averaged 543,645 last month versus 456,982 during September.
The insured rate of unemployment held steady at 4.3% and
matched its lowest since late-March. The rate reached a high of 5.2%
during late-June. During the last ten years, there has been a 93%
correlation between the level of the insured unemployment rate and the
overall rate of unemployment published by the Bureau of Labor
Statistics.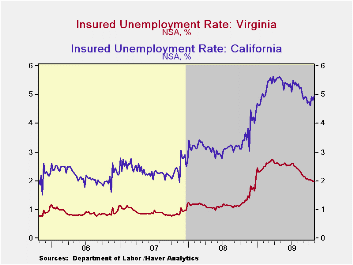
The highest insured unemployment rates in the week ending October 31 were in Puerto Rico (6.1%), Oregon (5.5), Nevada (5.2), California (5.0), Alaska (5.0), Arkansas (4.9), Wisconsin (4.9), Pennsylvania (4.8), Michigan (4.8), North Carolina (4.6), and South Carolina (4.6). The lowest insured unemployment rates were in North Dakota (1.1%), South Dakota (1.2), Virginia (2.0), Texas (2.5), Maine (2.6), Wyoming (2.8), Ohio (3.1), Maryland (3.1), New York (3.4), Mississippi (3.6) and Florida (3.7).
The unemployment insurance claims data is available in Haver's WEEKLY database and the state data is in the REGIONW database.
| Unemployment Insurance (000s) | 11/14/09 | 11/07/09 | 10/31/09 | Y/Y | 2008 | 2007 | 2006 |
|---|---|---|---|---|---|---|---|
| Initial Claims | 505 | 505 | 514 | -5.3% | 420 | 321 | 313 |
| Continuing Claims | -- | 5,611 | 5,650 | 39.5% | 3,342 | 2,552 | 2,459 |
| Insured Unemployment Rate (%) | -- | 4.3 | 4.3 | 3.1(11/2008) | 2.5 | 1.9 | 1.9 |

Tom Moeller
AuthorMore in Author Profile »Prior to joining Haver Analytics in 2000, Mr. Moeller worked as the Economist at Chancellor Capital Management from 1985 to 1999. There, he developed comprehensive economic forecasts and interpreted economic data for equity and fixed income portfolio managers. Also at Chancellor, Mr. Moeller worked as an equity analyst and was responsible for researching and rating companies in the economically sensitive automobile and housing industries for investment in Chancellor’s equity portfolio. Prior to joining Chancellor, Mr. Moeller was an Economist at Citibank from 1979 to 1984. He also analyzed pricing behavior in the metals industry for the Council on Wage and Price Stability in Washington, D.C. In 1999, Mr. Moeller received the award for most accurate forecast from the Forecasters' Club of New York. From 1990 to 1992 he was President of the New York Association for Business Economists. Mr. Moeller earned an M.B.A. in Finance from Fordham University, where he graduated in 1987. He holds a Bachelor of Arts in Economics from George Washington University.
More Economy in Brief


