 Global| Aug 18 2005
Philadelphia Fed Index Improved Further
by:Tom Moeller
|in:Economy in Brief
Summary
The Index of General Business Conditions in the manufacturing sector in August from the Philadelphia Fed added to the prior month's gain and rose to 17.5, the highest level since April. Consensus expectations had been for a lesser [...]
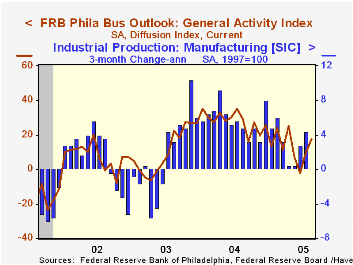
The Index of General Business Conditions in the manufacturing sector in August from the Philadelphia Fed added to the prior month's gain and rose to 17.5, the highest level since April. Consensus expectations had been for a lesser improvement to 14.0.
During the last ten years there has been a 68% correlation between the level of the Philadelphia Fed Business Conditions Index and three month growth in factory sector industrial production. There has been a 50% correlation with q/q growth in real GDP.
The sub indexes measuring new orders and shipments led with gains to the highest levels since April. The index covering the number of employees also rose. During the last ten years there has been a 64% correlation between the employment index and the three month growth in factory payrolls.
The business conditions index reflects a separate survey question, not the sub indexes.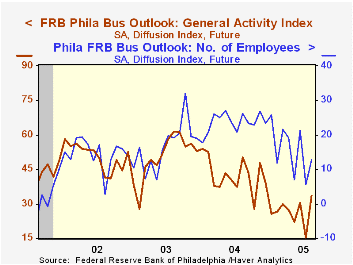
The separate index of expected business conditions in six months jumped to its best level this year led by expectations of increased hiring.
The prices paid index slipped and gave back a piece of the moderate improvement in July. During the last ten years there has been a 75% correlation between the prices paid index and the three month growth in the intermediate goods PPI. The correlation with the finished goods PPI has been 50% and with the CPI it's been 43%.
The Philadelphia Fed index is based on a survey of 250 regional manufacturing firms, but these firms sell nationally and internationally.
The latest Business Outlook survey from the Philadelphia Federal Reserve Bank can be found here.
| Philadelphia Fed Business Outlook | Aug | July | Aug '04 | 2004 | 2003 | 2002 |
|---|---|---|---|---|---|---|
| General Activity Index | 17.5 | 9.6 | 29.2 | 28.1 | 10.6 | 7.7 |
| Prices Paid Index | 25.9 | 26.5 | 54.3 | 51.3 | 16.8 | 12.3 |
by Tom Moeller August 18, 2005
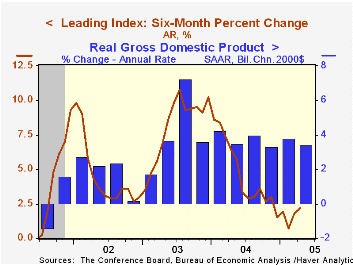
The Composite Index of Leading Economic Indicators reported by the Conference Board rose 0.1% during July following a upwardly revised 1.2% jump in June. Six-month growth in the leaders improved to 2.2%, the best since February.
The breadth of one month gain amongst the 10 components of the leading index slipped to 65% from 85% during June. A wider interest rate spread between the yield on 10 Year Treasuries & Fed Funds, higher stock prices and fewer claims for unemployment insurance made the largest positive contributions to the leader's July increase.
The method of calculating the contribution to the index from the interest rate yield spread has been revised. A negative contribution will now occur only when the spread inverts rather than when declining as in the past. More details can be found here.
The leading index is based on eight previously reported economic data series. Two series, orders for consumer goods and orders for capital goods, are estimated.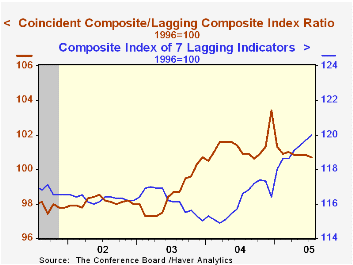
The coincident indicators rose 0.1% (2.6% y/y) with each of the four components up during the last three months.
The lagging indicators rose 0.3%, the same as during the prior month.
As higher short term interest rates and faster growth in the services CPI have raised the lagging indicators versus earlier declines, the ratio of coincident to lagging indicators has moved sideways this year and is down sharply from the December '04 peak. The ratio measures actual economic performance against economic excess.
Visit the Conference Board's site for coverage of leading indicator series from around the world.
The July 2005 Senior Loan Officer Opinion Survey on Bank Lending Practices from the Federal Reserve Board can be found here.
| Business Cycle Indicators | July | June | 6-Month Chg | 2004 | 2003 | 2002 |
|---|---|---|---|---|---|---|
| Leading | 0.1% | 1.2% | 2.2% | 7.7% | 5.1% | 5.0% |
| Coincident | 0.1% | 0.3% | 2.2% | 2.7% | 0.4% | -0.6% |
| Lagging | 0.3% | 0.3% | 3.4% | -0.1% | -0.1% | -0.7% |
by Tom Moeller August 18, 2005
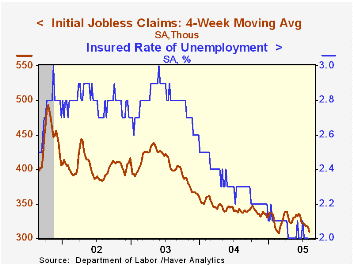
Initial claims for unemployment insurance increased 6,000 to 316,000 last week and reversed a revised 5,000 decline the week earlier. Consensus expectations had been for 310,000 claims.
Despite the increase, initial claims in August are 1.6% below the July average, however, the latest figure covers the survey week for August nonfarm payrolls and is up 3.6% from the July period.
During the last ten years there has been a (negative) 75% correlation between the level of initial claims for unemployment insurance and the monthly change in payroll employment.
The four week moving average of initial claims rose to 312,750 (-7.2% y/y).
Continuing claims for unemployment insurance rose 28,000 following a deepened 16,000 decline one week earlier.
The insured unemployment rate remained at the four year low of 2.0% for the fifth consecutive week.
| Unemployment Insurance (000s) | 08/13/05 | 08/06/05 | Y/Y | 2004 | 2003 | 2002 |
|---|---|---|---|---|---|---|
| Initial Claims | 316 | 310 | -5.1% | 343 | 402 | 404 |
| Continuing Claims | -- | 2,593 | -10.7% | 2,926 | 3,531 | 3,570 |
by Carol Stone August 18, 2005

The current extraordinary developments in the energy sector are teaching all of us new ideas and concepts. One of these recently called to our attention by a client is the refinery crack spread. Besides the surging price of crude oil, refiners are currently also able to increase the spread they receive from breaking the crude into its products, or "cracking" it. The common measure of this process assumes that a barrel of crude is broken two-thirds into gasoline and one-third into fuel oil -- or 3 barrels of crude make 2 barrels of gasoline and 1 barrel of fuel oil. This spread is thus called the "3-2-1 crack spread". This is such a common measure that there is futures market for it on the NYMEX, alongside crude and gasoline futures. Haver carries data for this in its OILWKLY database, which is supplied by the "Oil & Gas Journal".
The table below shows 1-month futures information: the estimated value of the gasoline and fuel oil produced by refiners and the resulting crack spread compared with the nearby future for West Texas Intermediate crude oil. We see that through last week, crude oil prices have risen 43.4% from a year ago while the refiners' crack spread has more than doubled from about $6.85/barrel to $14.06. The spread now adds a premium of 21.7% to the crude price compared with 15.1% a year ago. This is wide relative to the most recent past, but historical data show that this margin has been as high as nearly 49% with several periods sustained around 23-24%. So current values are hardly unprecedented, at least on a relative basis.
The other point clearly evident in both of our charts is the volatility of the crack spread from week to week. Such swings make it easy to see that refiners would want a futures market to hedge the spread, particularly given the substantial fixed costs of a refining plant. As refiners seek to cover these costs, plus labor and supplies, they face not only widely swinging crude oil prices, but also a margin on refining operations that is far from stable. One disclaimer: it is necessary to note also that relationships among these price measures are not exact. Other products come from the refining process -- residual fuel oil, jet fuel and gas oil are three notable ones -- so that the spread measure that includes only gasoline and distillate fuel oil is only a proxy, albeit a handy, easily understood one. Its recent widening indicates that demand for gasoline and fuel oil has been an important force supporting product prices: gasoline users have -- at least up to now -- been willing to pay these prices. With daily increases in gasoline, though, one wonders how long that will continue.
| 1-Month Futures, $/Barrel | Aug 12, 2005 | May 13, 2005 | Aug 13, 20042004 | 2003 | 2002 | ||
|---|---|---|---|---|---|---|---|
| $ | Yr/Yr % | ||||||
| Crude Oil, WTI | 64.91 | 50.35 | 45.25 | 43.4% | 41.29 | 30.98 | 26.04 |
| Estimated Product Value | 78.974 | 60.576 | 52.096 | 51.6% | 48.985 | 36.755 | 30.580 |
| Crack Spread | 14.060 | 10.224 | 6.848 | 105.32% | 7.690 | 5.782 | 4.537 |
| Spread as % of Crude Price | 21.7% | 20.3% | 15.1% | +6.6% | 19.1% | 18.7% | 17.6% |

Tom Moeller
AuthorMore in Author Profile »Prior to joining Haver Analytics in 2000, Mr. Moeller worked as the Economist at Chancellor Capital Management from 1985 to 1999. There, he developed comprehensive economic forecasts and interpreted economic data for equity and fixed income portfolio managers. Also at Chancellor, Mr. Moeller worked as an equity analyst and was responsible for researching and rating companies in the economically sensitive automobile and housing industries for investment in Chancellor’s equity portfolio. Prior to joining Chancellor, Mr. Moeller was an Economist at Citibank from 1979 to 1984. He also analyzed pricing behavior in the metals industry for the Council on Wage and Price Stability in Washington, D.C. In 1999, Mr. Moeller received the award for most accurate forecast from the Forecasters' Club of New York. From 1990 to 1992 he was President of the New York Association for Business Economists. Mr. Moeller earned an M.B.A. in Finance from Fordham University, where he graduated in 1987. He holds a Bachelor of Arts in Economics from George Washington University.
More Economy in Brief


