 Global| Aug 18 2006
Philadelphia Fed Index Highest Since 2005
by:Tom Moeller
|in:Economy in Brief
Summary
For August, the Philadelphia Federal Reserve Bank's Index of General Business Conditions in the manufacturing sector improved to 18.5 from an unrevised 6.0 during July. The rebound by far outpaced Consensus expectations for an uptick [...]
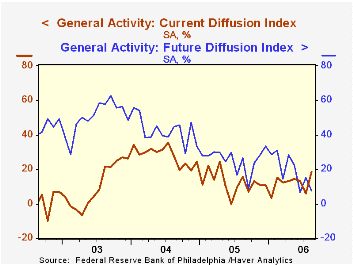
For August, the Philadelphia Federal Reserve Bank's Index of General Business Conditions in the manufacturing sector improved to 18.5 from an unrevised 6.0 during July. The rebound by far outpaced Consensus expectations for an uptick to 8.0 and was to the highest level since April of last year.
During the last ten years there has been a 65% correlation between the level of the Philadelphia Fed Business Conditions Index and three month growth in factory sector industrial production. There has been a 49% correlation with q/q growth in real GDP.
A higher level of shipments drove much of the improvement as the index rose twelve points to 22.3, its highest since March. The new orders sub-index also recovered most of the prior month's sharp decline. Moving in the other direction, the employment index reversed most of its July rebound but still indicated positive growth in factory payrolls. During the last ten years there has been a 75% correlation between the employment index and the three month growth in factory payrolls.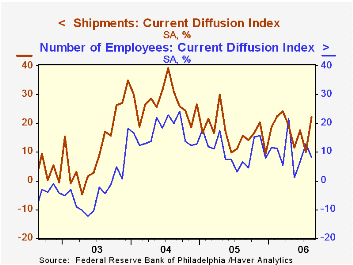
The business conditions index reflects a separate survey question, not the sub indexes.
The prices paid index fell sharply to the lowest level since April. During the last ten years there has been a 76% correlation between the prices paid index and the three month growth in the intermediate goods PPI. There has been an 85% correlation with the change in core intermediate goods prices.
The separate index of expected business conditions in six months reversed about all of its July improvement and during the third quarter the average monthly level (11.4) is down sharply from 2Q (19.2). Notably, expectations for orders and employment were either stable or improved during 3Q versus the 2Q average.
The latest Business Outlook survey from the Philadelphia Federal Reserve Bank can be found here.
| Philadelphia Fed Business Outlook | Aug | July | Aug '05 | 2005 | 2004 | 2003 |
|---|---|---|---|---|---|---|
| General Activity Index | 18.5 | 6.0 | 15.5 | 12.4 | 28.0 | 10.5 |
| Prices Paid Index | 45.3 | 50.3 | 26.9 | 43.5 | 51.2 | 16.8 |

Tom Moeller
AuthorMore in Author Profile »Prior to joining Haver Analytics in 2000, Mr. Moeller worked as the Economist at Chancellor Capital Management from 1985 to 1999. There, he developed comprehensive economic forecasts and interpreted economic data for equity and fixed income portfolio managers. Also at Chancellor, Mr. Moeller worked as an equity analyst and was responsible for researching and rating companies in the economically sensitive automobile and housing industries for investment in Chancellor’s equity portfolio. Prior to joining Chancellor, Mr. Moeller was an Economist at Citibank from 1979 to 1984. He also analyzed pricing behavior in the metals industry for the Council on Wage and Price Stability in Washington, D.C. In 1999, Mr. Moeller received the award for most accurate forecast from the Forecasters' Club of New York. From 1990 to 1992 he was President of the New York Association for Business Economists. Mr. Moeller earned an M.B.A. in Finance from Fordham University, where he graduated in 1987. He holds a Bachelor of Arts in Economics from George Washington University.
More Economy in Brief


