 Global| Aug 20 2020
Philadelphia Fed Factory Sector Activity Is Expanding
by:Tom Moeller
|in:Economy in Brief
Summary
• Component movement was mixed. • Expectations remain depressed. The Federal Reserve Bank of Philadelphia reported that its General Factory Sector Business Conditions Index fell in August to 17.2% from 24.1% during July. It was the [...]
• Component movement was mixed.
• Expectations remain depressed.
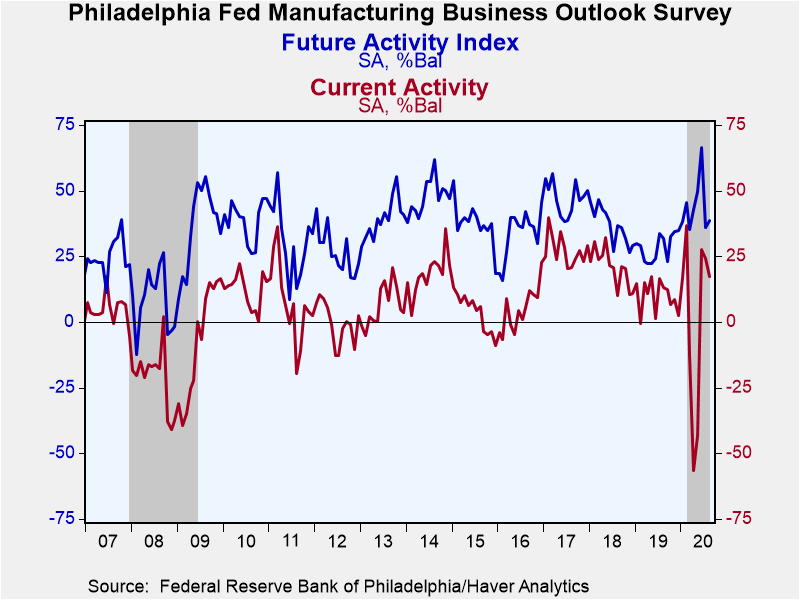
The Federal Reserve Bank of Philadelphia reported that its General Factory Sector Business Conditions Index fell in August to 17.2% from 24.1% during July. It was the third consecutive positive reading following three below zero. The Action Economics Forecast Survey expected a lesser decline to 22.0%. These figures are diffusion indexes where readings above zero indicate expansion. The percentage of firms reporting an improvement in business activity fell to 28% this month from 45% in July. The percentage reporting weaker conditions eased to 11% from 21%. The survey was taken during the week ended Monday.
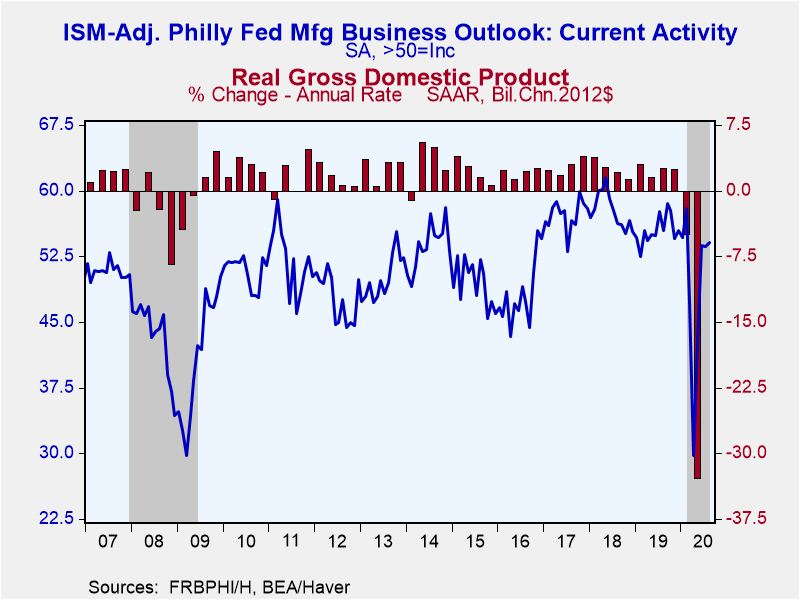
Haver Analytics constructs an ISM-Adjusted General Business Conditions Index. It improved to 54.1 this month and recovered last month's decline to 53.6. It was the third consecutive reading above 50, which indicates improvement in business activity. Over the past dozen years, there has been a 45% correlation between the ISM-Adjusted Philadelphia Fed Index and q/q change in real GDP.
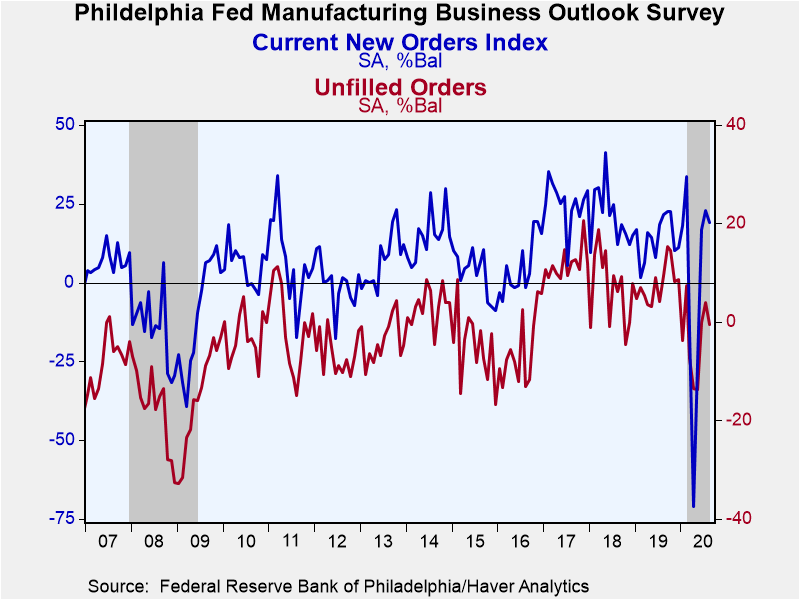
The underlying components of business activity, sampled separately from the composite index, continued to demonstrate varied performance. New orders & shipments both fell as did unfilled orders. The inventories and delivery times measures improved, the latter indicating the shortest pace of product delivery since December.
On the labor front, the employment index declined, but remained positive for the second straight month following three below zero. The workweek similarly eased following negative readings from April to June.
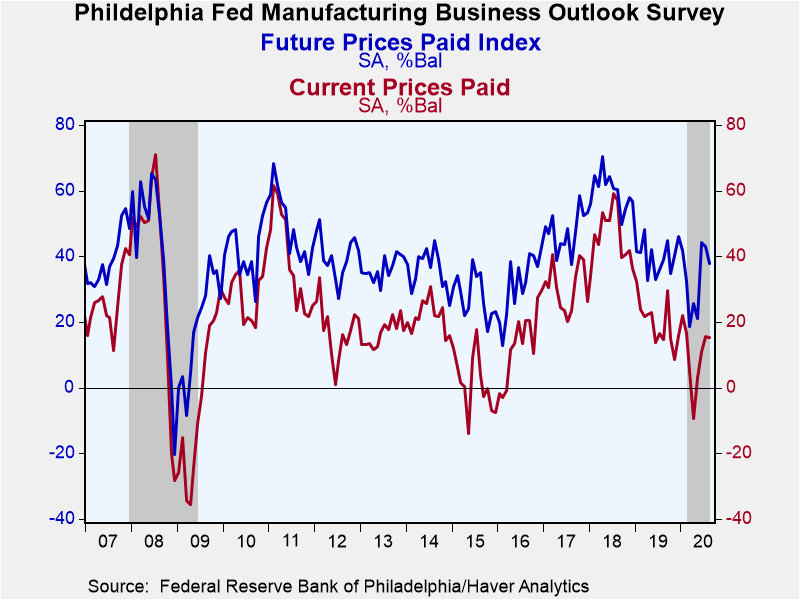
The index of prices paid was little changed this month at 15%. It was the fourth consecutive positive reading. An improved 21% of respondents reported paying higher prices while an increased six percent paid less. The index of prices received was fairly stable near 12% for the third straight month.
The Philadelphia Fed also surveys expectations for business activity in six months. The Future Activity Index edged higher to nearly 39% last month from 36% after falling sharply from 66% in June. Declines amongst the underlying series, however, were widespread.
The survey panel consists of 150 manufacturing companies in the third Federal Reserve District (which consists of southeastern Pennsylvania, southern New Jersey and Delaware). The diffusion indexes represent the percentage of respondents indicating an increase minus the percentage indicating a decrease in activity. The ISM-adjusted figure, calculated by Haver Analytics, is the average of five diffusion indexes: new orders, shipments, employment, delivery times and inventories with equal weights (20% each). Each ISM-adjusted index is the sum of the percent responding "higher" and one-half of the percent responding "no change."
The figures from the Philadelphia Federal Reserve dating back to 1968 can be found in Haver's SURVEYS database. The expectation from the Action Economics Forecast Survey is available in AS1REPNA.
| Philadelphia Fed - Manufacturing Business Outlook Survey (%, SA) | Aug | Jul | Jun | Aug'19 | 2019 | 2018 | 2017 |
|---|---|---|---|---|---|---|---|
| ISM-Adjusted Business Conditions | 54.1 | 53.6 | 53.7 | 55.4 | 55.5 | 57.7 | 57.2 |
| General Factory Sector Business Conditions | 17.2 | 24.1 | 27.5 | 13.1 | 9.9 | 20.9 | 27.3 |
| New Orders | 19.0 | 23.0 | 16.7 | 21.6 | 14.1 | 21.0 | 25.3 |
| Shipments | 9.4 | 15.3 | 25.3 | 18.1 | 16.9 | 22.8 | 26.7 |
| Unfilled Orders | -0.6 | 3.9 | -0.1 | 9.5 | 7.7 | 7.0 | 11.8 |
| Delivery Time | 7.3 | -6.4 | 0.4 | 9.8 | 9.4 | 9.5 | 10.6 |
| Inventories | -1.9 | -11.8 | 0.0 | 6.9 | 5.1 | 7.2 | 2.8 |
| Number of Employees | 9.0 | 20.1 | -4.3 | 5.9 | 16.9 | 21.5 | 16.1 |
| Average Workweek | 11.3 | 17.2 | -6.5 | 5.7 | 9.8 | 15.9 | 14.9 |
| Prices Paid | 15.3 | 15.7 | 11.1 | 14.7 | 19.7 | 46.1 | 30.4 |
| Expectations - General Business Conditions; Six Months Ahead | 38.8 | 36.0 | 66.3 | 31.8 | 28.4 | 36.8 | 47.1 |
Tom Moeller
AuthorMore in Author Profile »Prior to joining Haver Analytics in 2000, Mr. Moeller worked as the Economist at Chancellor Capital Management from 1985 to 1999. There, he developed comprehensive economic forecasts and interpreted economic data for equity and fixed income portfolio managers. Also at Chancellor, Mr. Moeller worked as an equity analyst and was responsible for researching and rating companies in the economically sensitive automobile and housing industries for investment in Chancellor’s equity portfolio. Prior to joining Chancellor, Mr. Moeller was an Economist at Citibank from 1979 to 1984. He also analyzed pricing behavior in the metals industry for the Council on Wage and Price Stability in Washington, D.C. In 1999, Mr. Moeller received the award for most accurate forecast from the Forecasters' Club of New York. From 1990 to 1992 he was President of the New York Association for Business Economists. Mr. Moeller earned an M.B.A. in Finance from Fordham University, where he graduated in 1987. He holds a Bachelor of Arts in Economics from George Washington University.


