 Global| Apr 21 2006
Philadelphia Fed Business Activity Index Up Slightly
by:Tom Moeller
|in:Economy in Brief
Summary
The Philadelphia Fed Index of General Business Conditions in the manufacturing sector during April rose slightly to 13.2 from an unrevised 12.3 last month. The 0.9 point m/m increase fell somewhat short of Consensus expectations for a [...]
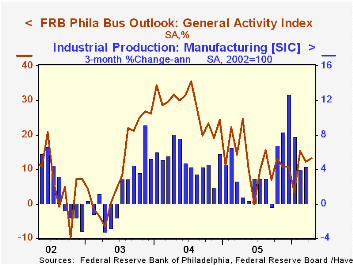
The Philadelphia Fed Index of General Business Conditions in the manufacturing sector during April rose slightly to 13.2 from an unrevised 12.3 last month. The 0.9 point m/m increase fell somewhat short of Consensus expectations for a rise to 14.8.
During the last ten years there has been a 65% correlation between the level of the Philadelphia Fed Business Conditions Index and three month growth in factory sector industrial production. There has been a 49% correlation with q/q growth in real GDP.
Declines in the sub indexes again were broad based as new orders reversed all of the jump during March and shipments reversed the gains of the prior two months. Moving in the other direction, the index covering the number of employees surged to the highest level (21.7) since late 2004. During the last ten years there has been a 75% correlation between the employment index and the three month growth in factory payrolls.
The business conditions index reflects a separate survey question, not the sub indexes.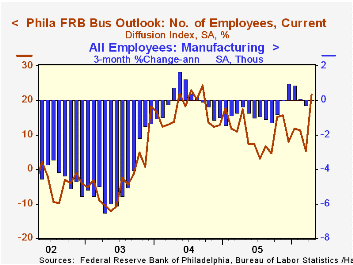
The prices paid index recovered virtually all of last month's decline. During the last ten years there has been a 76% correlation between the prices paid index and the three month growth in the intermediate goods PPI. There has been an 85% correlation with the change in core intermediate goods prices.
The separate index of expected business conditions in six months recovered nearly all of last month's decline and rose to 28.2, near the highs of the last year. Expectations for employment recovered moderately.
The latest Business Outlook survey from the Philadelphia Federal Reserve Bank can be found here.
| Philadelphia Fed Business Outlook | April | Mar | April '05 | 2005 | 2004 | 2003 |
|---|---|---|---|---|---|---|
| General Activity Index | 13.2 | 12.3 | 24.6 | 12.4 | 28.0 | 10.5 |
| Prices Paid Index | 29.0 | 17.2 | 47.6 | 43.5 | 51.2 | 16.8 |
by Tom Moeller April 21, 2006
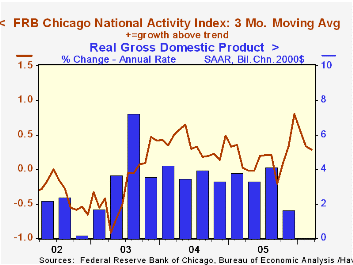
The Federal Reserve Bank of Chicago indicated that the National Activity Index (CFNAI) recovered during March to 0.37 from 0.19 in February. The three-month moving average of the CFNAI, however, fell slightly to 0.29 from 0.34.
A zero value of the CFNAI indicates that the economy is expanding at its historical trend rate of growth and during the last twenty years there has been a 68% correlation between the level of the CFNAI and q/q growth in real GDP.
The CFNAI is a weighted average of 85 indicators of economic activity. The indicators reflect activity in the following categories: production and income, the labor market, personal consumption and housing, manufacturing and trade sales, and inventories & orders.
The latest CFNAI report is available here.
Yield Curve Inversions and Cyclical Peaks from the Federal Reserve Bank of St. Louis can be found here.
| Chicago Fed | Mar | Feb | Mar '05 | 2005 | 2004 | 2003 |
|---|---|---|---|---|---|---|
| CFNAI | 0.37 | 0.19 | -0.21 | 0.20 | 0.37 | -0.11 |
by Tom Moeller April 21, 2006
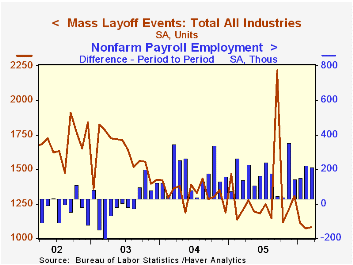
The number of mass layoff events last month ticked up 0.8% after sharp declines during the prior two months. During all of 1Q, the number of events fell 9.9% from 4Q 2005.
During the last ten years there has been a (negative) 87% correlation between the three month average level of layoff announcements and the y/y change in payroll employment.
The number of persons affected in December by mass layoffs increased a larger 6.4% during March after a 2.9% February rise. Nevertheless, the 1Q level was down 9.7% from 4Q 2005. Layoffs in the transportation equipment sector (+10.4% y/y) have been significant and quite volatile m/m.
The Mass Layoff Statistics (MLS) program collects reports on mass layoff actions that result in workers being separated from their jobs. Monthly mass layoff numbers are from establishments which have at least 50 initial claims for unemployment insurance (UI) filed against them during a 5-week period.
Company mass layoffs: The "other" job shock from the Federal Reserve Bank of Minneapolis is available here.
| Mass Layoffs | Mar | Feb | Y/Y | 2005 | 2004 | 2003 |
|---|---|---|---|---|---|---|
| All US Industries (# Events, SA) | 1,082 | 1,073 | -10.1% | 15,699 | 15,926 | 19,220 |
| Total (# Persons, SA) | 118,555 | 111,468 | -11.5% | 1,722,452 | 1,591,081 | 1,946,548 |
by Carol Stone April 21, 2006
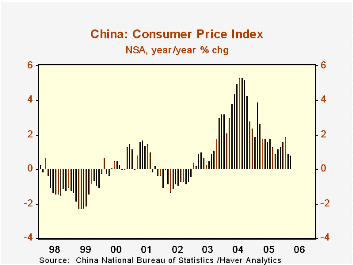
The inflation picture in Asia is harder to interpret than that in Europe because the economies have such different structures and the data collection and definitions are less standardized. Three countries reporting today for March show widely varying patterns of consumer price behavior.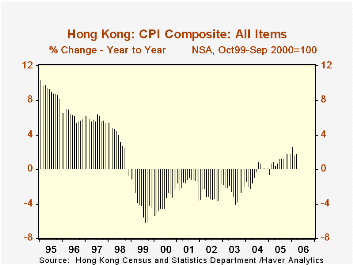
In China, the overall CPI trend shows quite modest gains over the last couple of months, and inflation has definitely slowed from a couple of years ago. Prices of household goods and services are headed higher, which may reflect heating costs, and clothing price changes are distinctly less negative than before. But tobacco and alcohol products, recreation and culture and shelter are slowing down. These outweigh the firming tendencies, so, at just 0.8% year-to-year in March, total CPI inflation in China is the lowest since mid-2003.
In Hong Kong, consumer prices have turned up after a period of outright deflation from 1999 through mid-2004. This too may be energy related as transportation and housing costs are the main movers. Clothing and alcohol and tobacco, though, are exerting downward pressure and durable goods prices are maintaining a steady downward trend at about a 2.5% annual rate. So, while inflation has returned in Hong Kong, it seems to be sustained at a quite moderate pace.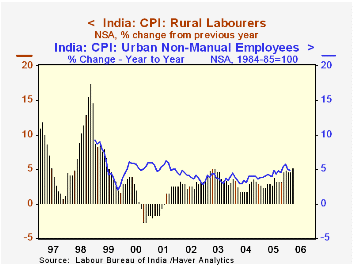
India encompasses at least two completely different economies, the urban sector and the rural. Inflation in both is presently about equal, however, with the CPI for rural laborers running at 5.3%, year-on-year, in March and 4.7% in February; this follows 4.9% in 2005 and is considerably higher than the 3% range that prevailed in prior years. The current pace is similar for "urban non-manual employees", at 4.8% in February, although off somewhat from the 5.7% rate for 2005. While we might be concerned over the seemingly rapid pace of Indian inflation at present, it compares quite favorably with 7%-10% rates during the 1980s and 1990s.
These data are all found in Haver's EMERGEPR database, which we maintain directly from country sources. Regional data for China are carried in the premium CHINA database which we market from CEIC, prominent economic consultants in Asia.
| Yr/Yr % Change, NSA | Mar 2006 | Feb 2006 | Jan 2006 | December/December||||
|---|---|---|---|---|---|---|---|
| 2005 | 2004 | 2003 | 2002 | ||||
| China | 0.8 | 0.9 | 1.9 | 1.6 | 2.4 | 3.2 | -0.6 |
| Hong Kong | 1.8 | 1.6 | 2.6 | 1.8 | 0.2 | -1.9 | -1.6 |
| India: Rural Laborers | 5.3 | 4.7 | 4.7 | 4.9 | 3.0 | 3.1 | 3.2 |
| India: Urban Non-Manual Employees | -- | 4.8 | 5.0 | 5.7 | 3.6 | 4.0 | 2.8 |

Tom Moeller
AuthorMore in Author Profile »Prior to joining Haver Analytics in 2000, Mr. Moeller worked as the Economist at Chancellor Capital Management from 1985 to 1999. There, he developed comprehensive economic forecasts and interpreted economic data for equity and fixed income portfolio managers. Also at Chancellor, Mr. Moeller worked as an equity analyst and was responsible for researching and rating companies in the economically sensitive automobile and housing industries for investment in Chancellor’s equity portfolio. Prior to joining Chancellor, Mr. Moeller was an Economist at Citibank from 1979 to 1984. He also analyzed pricing behavior in the metals industry for the Council on Wage and Price Stability in Washington, D.C. In 1999, Mr. Moeller received the award for most accurate forecast from the Forecasters' Club of New York. From 1990 to 1992 he was President of the New York Association for Business Economists. Mr. Moeller earned an M.B.A. in Finance from Fordham University, where he graduated in 1987. He holds a Bachelor of Arts in Economics from George Washington University.


