 Global| Mar 16 2006
Philadelphia Fed Business Activity Index Off
by:Tom Moeller
|in:Economy in Brief
Summary
The March Philadelphia Fed Index of General Business Conditions in the manufacturing sector gave back 3.1 points of the 12.1 point improvement last month. The decline to 12.3 compared to Consensus expectations for a lesser decline to [...]

The March Philadelphia Fed Index of General Business Conditions in the manufacturing sector gave back 3.1 points of the 12.1 point improvement last month. The decline to 12.3 compared to Consensus expectations for a lesser decline to 14.
During the last ten years there has been a 68% correlation between the level of the Philadelphia Fed Business Conditions Index and three month growth in factory sector industrial production. There has been a 50% correlation with q/q growth in real GDP.
Declines in the sub indexes were broad based although new orders rose sharply to the highest level since October 2004 and shipments rose moderately. Unfilled orders fell sharply as did delivery times. The index covering the number of employees halved and fell to 5.4. During the last ten years there has been a 64% correlation between the employment index and the three month growth in factory payrolls.
The business conditions index reflects a separate survey question, not the sub indexes.
The separate index of expected business conditions in six months halved and fell to 14.6. Expectations for employment also moved moderately lower.
The prices paid index fell sharply though the index of future prices fell only moderately. During the last ten years there has been a 75% correlation between the prices paid index and the three month growth in the intermediate goods PPI. The correlation with the finished goods PPI has been 50% and with the CPI it's been 43%.
The latest Business Outlook survey from the Philadelphia Federal Reserve Bank can be found here.
Global Imbalances or Bad Accounting? The Missing Dark Matter in the Wealth of Nations, analysis from the NBER and the Harvard University - John F. Kennedy School of Government is available here.
| Philadelphia Fed Business Outlook | Mar | Feb | Mar '05 | 2005 | 2004 | 2003 |
|---|---|---|---|---|---|---|
| General Activity Index | 12.3 | 15.4 | 14.2 | 12.4 | 28.0 | 10.5 |
| Prices Paid Index | 17.2 | 30.5 | 28.6 | 43.5 | 51.2 | 16.8 |
by Tom Moeller March 16, 2006
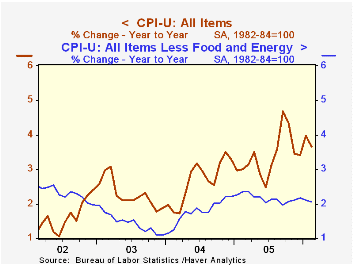
The February consumer price index (CPI-U) rose an expected 0.1% on the heels of the 0.7% spurt during January.
Price declines for most fuels dragged energy prices lower by 1.2%. Natural gas prices fell 4.5% (+26.8% y/y) and fuel oil prices dropped for the fifth straight month, down 2.8% (+24.2% y/y). Gasoline prices fell 1.0% (20.6% y/y) and dented the 6.4% January surge but in March, gasoline prices moved higher to $2.37 per gallon last week from the $2.28 February average.
Prices less food & energy rose a modest 0.1% that was less than the 0.2% Consensus expectation. Prices for core goods fell 0.1% due to a 1.0% (-1.7% y/y) decline in apparel prices and no change (0.5% y/y) in the prices for household furnishings & operation. Medical care commodity prices rose 0.3% (3.8% y/y).
A 0.3% increase in core services prices reflected a 0.4% (2.6% y/y) increase in shelter prices and a 0.5% (4.1% y/y) increase in prices for medical care services prices. School tuition & fees rose 0.3% (6.2% y/y) while public transportation prices fell 0.2% (+7.5% y/y).
Click here for a discussion of Owners Equivalent Rent and the Cost of Living by Federal Reserve Bank of New York economist Charles Steindel. This paper was presented at the Annual Meeting of the National Association for Business Economics (www.nabe.com) and later published in the January 2006 issue of the NABE journal Business Economics.
The gain in the chained CPI, which adjusts for shifts in the mix of consumer purchases, eased to 0.2% but less food & energy prices rose 0.4%.
The Federal Reserve Board's latest Beige Book can be found here.
| Consumer Price Index | Feb | Jan | Y/Y | 2005 | 2004 | 2003 |
|---|---|---|---|---|---|---|
| Total | 0.1% | -0.7% | 2.6% | 3.4% | 2.7% | 2.3% |
| Total less Food & Energy | 0.1% | 0.2% | 2.1% | 2.2% | 1.8% | 1.5% |
| Goods less Food & Energy | -0.1% | 0.2% | 0.0% | 0.5% | -0.9% | -2.0% |
| Services less Energy | 0.3% | 0.2% | 2.9% | 2.8% | 2.8% | 2.9% |
| Energy | -1.2% | 5.0% | 20.1% | 16.9% | 10.9% | 12.2% |
| Food | 0.1% | 0.5% | 2.8% | 2.4% | 3.4% | 2.1% |
| Chained CPI: Total (NSA) | 0.2% | 0.7% | 3.0% | 2.9% | 2.5% | 2.0% |
| Total less Food & Energy | 0.4% | 0.3% | 1.8% | 1.9% | 1.7% | 1.1% |
by Tom Moeller March 16, 2006
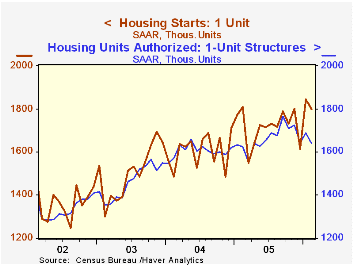
Housing starts during February reversed roughly half of the prior month's upwardly revised rise and fell 7.9% m/m to 2.120M units. More normal Winter temperatures returned last month after the record warmth of January. Consensus expectations had been for a sharper decline to 2.03M starts.
The reason for the relatively moderate decline last month was that single-family starts fell just 2.3% to 1.800M from the record high in January. The two month average of 1.822M starts was still a record height. 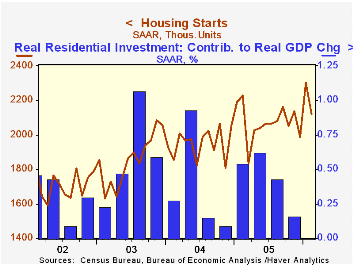
A 30.4% m/m decline in multi family starts more than reversed the January surge.
Building permits also fell moderately reversing about half of February's unrevised gain with a 3.2% decline. Single family permits, however, fell hard. A 3.0% (+0.9% y/y) decline dropped single family permits to the lowest level since last May.
Single family housing starts in the Northeast fell 20.1% (-12.9% y/y) and in the Midwest starts dropped 9.2% (-15.9% y/y). Single family starts in the South fell 3.6% (+6.0% y/y) but out West starts recovered 13.3% (3.8% y/y).
| Housing Starts (000s, AR) | Feb | Jan | Y/Y | 2005 | 2004 | 2003 |
|---|---|---|---|---|---|---|
| Total | 2,120 | 2,303 | -4.8% | 2,072 | 1,950 | 1,854 |
| Single-family | 1,800 | 1,843 | -0.4% | 1,716 | 1,604 | 1,505 |
| Multi-family | 320 | 460 | -23.8% | 355 | 345 | 349 |
| Building Permits | 2,145 | 2,216 | 2.5% | 2,122 | 2,058 | 1,8 88 |
by Tom Moeller March 16, 2006
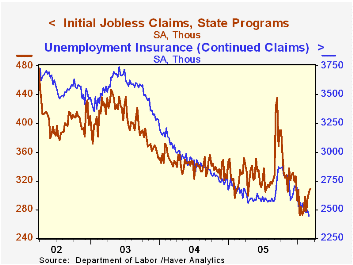
Initial claims for unemployment insurance rose for the third consecutive week. Last week's gain of 5,000 to 309,000 followed a little revised 9,000 increase the prior period and it was to the highest level this year. Consensus expectations had been for 300,000 claims.
During the last ten years there has been a (negative) 75% correlation between the level of initial jobless insurance claims and the m/m change in payroll employment.
The four-week moving average of initial claims increased to 296,500 (-8.0% y/y), its highest level since mid-January.
Continuing unemployment insurance claims fell 49,000 to 2.445M, a five year low, and reversed all of a downwardly revised 17,000 gain the prior week.
The insured rate of unemployment was stable at 1.9% for the fifth week.
The Trend Growth Rate of Employment: Past, Present and Future from the Federal Reserve Bank of Kansas City can be found here.
| Unemployment Insurance (000s) | 03/11/06 | 03/04/06 | Y/Y | 2005 | 2004 | 2003 |
|---|---|---|---|---|---|---|
| Initial Claims | 309 | 304 | -6.1% | 332 | 343 | 402 |
| Continuing Claims | -- | 2,445 | -7.6% | 2,663 | 2,924 | 3,532 |
by Carol Stone March 16, 2006
Yesterday here, we talked about the persistent sluggishness of employment in the UK. A few weeks ago, we had a similar discussion about Germany. While these two large European economies are seeing their labor markets struggle, those of some other countries are doing comparatively better.
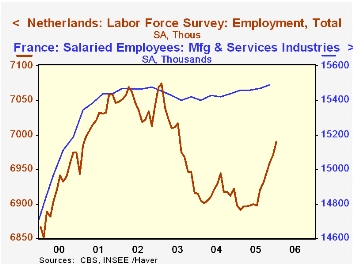
Even in France, where riots in early November highlighted the plight of one specific segment of the labor force, employment is actually rising. The increase is not large, but in Q4, there were 20,500 new jobs in manufacturing and services industries, bringing their total to 15.489 million, a new high. As in many Western countries, the gains are all in the service sector and for France, especially in consulting and other business services. Unemployment in France has also continued to decrease, with the 9.6% rate in December and January the lowest since January 2003. The sensitive youth age range, under 25, saw an uptick in January to 22.2%, but this remains below the high last May of 22.8%.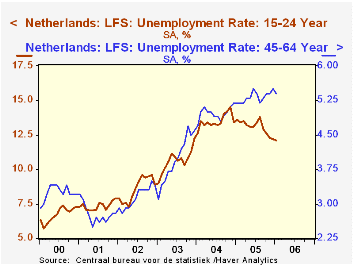
In the Netherlands, as seen in the graph, employment fell sharply in 2003, much more so than in France, but it bounced back, particularly over the past six months. While not reaching a new peak, Dutch employment has regained more than half of its 184,000 drop between February 2003 and February 2005. Unemployment in the Netherlands is falling, with the rate down to 6.1% in January from a peak of 6.7% in February 2005. By age group, progress here is actually most noticeable in the younger segments. Unemployment for those under 25 was 12.1%, compared to 13.4% early in 2005 and as high as 14.5% in late 2004. Adult workers under 45 face only 5.6% unemployment, down slightly over the past year. Older workers, ages 45-64, also have unemployment rates in the mid-5% range, but they have remained stubbornly at that level all through the past 15 months.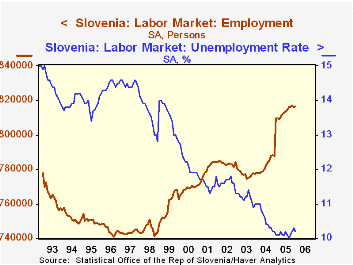
In one of the smaller European nations, Slovenia, jobs have increased modestly over the last year. In January, employment was 816,600, up from an average of 813,100 for all of last year and 809,700 for January a year ago. Unemployment increased slightly this January, but it has undergone a secular decline throughout almost the entirety of Slovenia's period of independence, carrying the rate down to just over 10% from 15% in late 1992. [Note that the data collection method changed at the beginning of 2005, accounting for the sudden jump in employment then. The labor force increased by a commensurate amount so the unemployment rate was not affected.]
Thus, labor markets can behave differently even in neighboring regions and among differing demographic groups within the same region. And as we see here, big economies don't necessarily have advantages over small ones in the ability to provide job opportunities for everyone.
| Q4 2005 | Q3 2005 | Year Ago | 2005 | 2004 | 2003 | ||
|---|---|---|---|---|---|---|---|
| France: Mfg & Services Employees (Mil.) |
-- | 15.49 | 15.47 | 15.44 | 15.47 | 15.42 | 15.43 |
| Manufacturing | -- | 5.13 | 5.14 | 5.18 | 5.15 | 5.20 | 5.28 |
| Services | -- | 10.35 | 10.33 | 10.26 | 10.32 | 10.22 | 10.15 |
| Jan 2006 | Dec 2005 | -- | Year Ago | 2005 | 2004 | 2003 | |
| Unemployment Rate (%) | 9.6 | 9.6 | -- | 10.1 | 9.9 | 10.0 | 9.9 |
| Netherlands: Total Employment* | 6.99 | 6.97 | -- | 6.90 | 6.91 | 6.92 | 7.00 |
| Unemployment Rate (%) | 6.1 | 6.2 | -- | 6.7 | 6.5 | 6.5 | 5.4 |
| Slovenia: Employment (Thous.) | 816.6 | 816.2 | -- | 809.7 | 813.1 | 782.2 | 777.2 |
| Unemployment Rate (%) | 10.2 | 10.3 | -- | 10.1 | 10.1 | 10.6 | 11.2 |

Tom Moeller
AuthorMore in Author Profile »Prior to joining Haver Analytics in 2000, Mr. Moeller worked as the Economist at Chancellor Capital Management from 1985 to 1999. There, he developed comprehensive economic forecasts and interpreted economic data for equity and fixed income portfolio managers. Also at Chancellor, Mr. Moeller worked as an equity analyst and was responsible for researching and rating companies in the economically sensitive automobile and housing industries for investment in Chancellor’s equity portfolio. Prior to joining Chancellor, Mr. Moeller was an Economist at Citibank from 1979 to 1984. He also analyzed pricing behavior in the metals industry for the Council on Wage and Price Stability in Washington, D.C. In 1999, Mr. Moeller received the award for most accurate forecast from the Forecasters' Club of New York. From 1990 to 1992 he was President of the New York Association for Business Economists. Mr. Moeller earned an M.B.A. in Finance from Fordham University, where he graduated in 1987. He holds a Bachelor of Arts in Economics from George Washington University.
More Economy in Brief


