 Global| Mar 17 2005
Philadelphia Fed Activity Index Fell
by:Tom Moeller
|in:Economy in Brief
Summary
The Philadelphia Fed's Index of General Business Conditions in the manufacturing sector fell in March to 11.4 from an unrevised 23.9 in February. Consensus expectations had been for a reading of 20.0. The latest was the lowest reading [...]
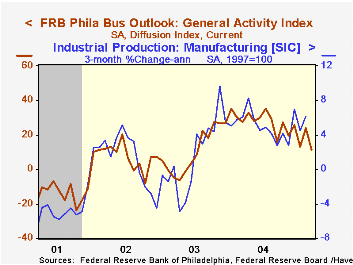
The Philadelphia Fed's Index of General Business Conditions in the manufacturing sector fell in March to 11.4 from an unrevised 23.9 in February. Consensus expectations had been for a reading of 20.0. The latest was the lowest reading since July 2003.
During the last ten years there has been a 69% correlation between the level of the Philadelphia Fed Business Conditions Index and three month growth in factory sector industrial production. There has been a 52% correlation with q/q growth in real GDP.
The shipments index fell a hard 9.1 points. The number of employees fell 2.2 points and the index level is half what it was last summer but new orders rose again off the January low. During the last ten years there has been a 64% correlation between the employment index and the three month growth in factory payrolls.
The business conditions index reflects a separate survey question, not the sub indexes.
The separate index of expected business conditions in six months improved moderately to the highest level this year.
The prices paid index fell again, to the lowest level since November 2003. During the last ten years there has been a 75% correlation between the prices paid index and the three month growth in the intermediate goods PPI. The correlation with the finished goods PPI has been 50% and with the CPI it's been 43%.
The Philadelphia Fed index is based on a survey of 250 regional manufacturing firms, but these firms sell nationally and internationally.
The latest Business Outlook survey from the Philadelphia Federal Reserve Bank can be found here.
| Philadelphia Fed Business Outlook | Mar | Feb | Mar '04 | 2004 | 2003 | 2002 |
|---|---|---|---|---|---|---|
| General Activity Index | 11.4 | 23.9 | 27.5 | 28.1 | 10.6 | 7.7 |
| Prices Paid Index | 29.7 | 43.5 | 49.6 | 51.3 | 16.8 | 12.3 |
by Tom Moeller March 17, 2005
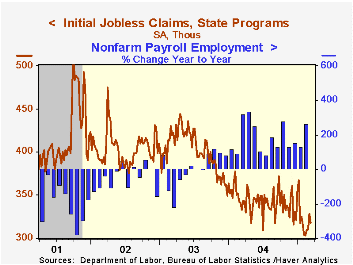
Initial claims for unemployment insurance fell 10,000 to 318,000 last week after a revised 18,000 increase the prior week. Consensus expectations had been for 317,000 claims.
The latest figure covers the survey period for March nonfarm payrolls and claims were up 15,000 (5.0%) from the February period.
During the last ten years there has been a (negative) 75% correlation between the level of initial claims for unemployment insurance and the monthly change in payroll employment. There has been a (negative) 66% correlation with the level of continuing claims.
The four week moving average of initial claims rose to 316,500 (-7.5% y/y).
Continuing claims for unemployment insurance fell 48,000 from the prior week and the insured rate of unemployment remained at 2.1%.Federal Reserve Board Chairman Alan Greenspan's testimony titled Future of the Social Security program and economics of retirement can be found here.
| Unemployment Insurance (000s) | 03/12/05 | 03/05/05 | Y/Y | 2004 | 2003 | 2002 |
|---|---|---|---|---|---|---|
| Initial Claims | 318 | 328 | -4.5% | 343 | 402 | 404 |
| Continuing Claims | -- | 2,647 | -14.0% | 2,926 | 3,531 | 3,570 |
by Tom Moeller March 17, 2005
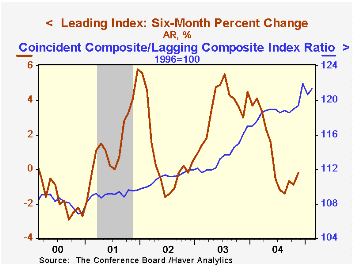
The Conference Board reported that the Composite Index of Leading Economic Indicators ticked 0.1% higher in February following an unrevised 0.3% decline the prior month. Six-month growth in the leaders remained negative at -0.2%. Growth in the leaders deeper than -2.5% preceded past US recessions.
The breadth of one month gain amongst the 10 components of the leading index improved markedly to 60% from a downwardly revised 25% in January. Fewer claims for unemployment insurance and higher stock prices were the main positive contributors to last month's leading index increase.
The leading index is based on eight previously reported economic data series. Two series, orders for consumer goods and orders for capital goods, are estimated.
The coincident indicators recovered 0.4% following a downwardly revised 0.6% decline in January. Six-month growth in the index was 3.3% and during the last ten years there has been an 84% correlation between six month growth in the coincident indicators and two quarter growth in real GDP.
The lagging indicators rose 0.4% and have been moving higher for most of the last year versus declines during the prior three years. Higher C&I loans account for much of the gain.
The ratio of the coincident to the lagging indicators which measures actual economic performance relative to excess rose 0.5% (3.1% y/y).
Visit the Conference Board's site for coverage of leading indicator series from around the world.
| Business Cycle Indicators | Feb | Jan | 6-Month Chg | 2004 | 2003 | 2002 |
|---|---|---|---|---|---|---|
| Leading | 0.1% | -0.3% | -0.2% | 3.0% | 1.3% | 2.2% |
| Coincident | 0.4% | -0.6% | 3.3% | 2.6% | 0.4% | -0.5% |
| Lagging | 0.4% | 1.0% | 1.0% | -2.0% | -1.9% | -2.3% |
by Carol Stone March 17, 2005
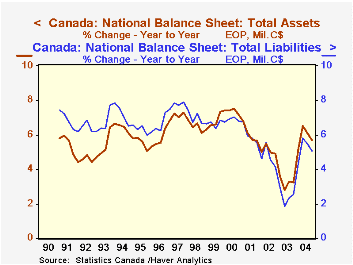
Canada's overall financial condition improved markedly in 2004, according to National Balance Sheet data report today by Statistics Canada. Total assets grew 5.7% and nonfinancial assets also grew 5.7%, both more than in 2003. Nonfinancial assets include buildings, equipment, consumer durable goods and the value of land; this sum is also known as "national wealth". Total liabilities expanded by 5.1%, more than the year before, but less than assets. So the difference, a measure of net worth for the entire economy, grew by 6.9% to nearly C$4.4 trillion. These data are all contained in Haver's CANSIM database.
Total assets in Canada have grown more rapidly than total liabilities since the middle of 1999, as seen in the first chart. Growth of both slowed with sagging share values and the slowdown in activity during 2001, but assets have remained on a stronger uptrend than liabilities. Nonfinancial assets have increased at a higher rate than liabilities since 2002.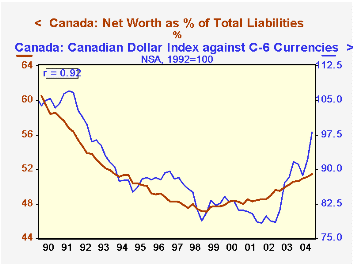
These overall relationships in the Canadian economy and financial system have an interesting relationship to the value of the Canadian currency. The second chart shows a substantial 92% correlation between the ratio of net worth to total liabilities and an index of the Canadian dollar against six other currencies. This ratio may be seen as an indication of leverage: how big is the role of debt in financing macroeconomic activity the nation. It seems intuitive that such a fundamental measure of economic conditions might influence the currency value. In the last couple of years, the weakness of the US dollar may have dominated as a determinant of the exchange rate. Even so, through the 15-year history of the balance sheet data, it is fascinating that the Canadian dollar weakened as long as net worth deteriorated relative to borrowing, but has tended higher since that ratio turned upward in 1999.
| Canada Billions Canadian $ |
2004 | 2003 | 2002 | 2001 | 2000 |
|---|---|---|---|---|---|
| Total Assets | 12,865.0 | 12,171.0 | 11,789.5 | 11,240.1 | 10,636.2 |
| % Change | 5.7 | 3.2 | 4.9 | 5.7 | 7.2 |
| Nonfinancial Assets (National Wealth) | 4,420.8 | 4,182.2 | 3,977.6 | 3,747.6 | 3,559.9 |
| % Change | 5.7 | 5.1 | 6.1 | 5.3 | 5.2 |
| Total Liabilities* | 8,495.4 | 8,084.8 | 7,883.4 | 7,572.1 | 7,174.6 |
| % Change | 5.1 | 2.6 | 4.1 | 5.5 | 6.8 |
| Net Worth (Assets - Liabilities) | 4,369.5 | 4,086.2 | 3,906.1 | 3,668.0 | 3,461.7 |
| % Change | 6.9 | 4.6 | 6.5 | 6.0 | 7.9 |

Tom Moeller
AuthorMore in Author Profile »Prior to joining Haver Analytics in 2000, Mr. Moeller worked as the Economist at Chancellor Capital Management from 1985 to 1999. There, he developed comprehensive economic forecasts and interpreted economic data for equity and fixed income portfolio managers. Also at Chancellor, Mr. Moeller worked as an equity analyst and was responsible for researching and rating companies in the economically sensitive automobile and housing industries for investment in Chancellor’s equity portfolio. Prior to joining Chancellor, Mr. Moeller was an Economist at Citibank from 1979 to 1984. He also analyzed pricing behavior in the metals industry for the Council on Wage and Price Stability in Washington, D.C. In 1999, Mr. Moeller received the award for most accurate forecast from the Forecasters' Club of New York. From 1990 to 1992 he was President of the New York Association for Business Economists. Mr. Moeller earned an M.B.A. in Finance from Fordham University, where he graduated in 1987. He holds a Bachelor of Arts in Economics from George Washington University.
More Economy in Brief


