 Global| Mar 24 2009
Petroleum Prices Strengthen On Potential Tightening Of Crude Supplies
by:Tom Moeller
|in:Economy in Brief
Summary
The potential for OPEC restraint in crude oil production recently helped to lift prices for crude oil. For a barrel of West Texas Intermediate prices rose last week to $49.46, up roughly 50% from the December low of $32.37 per barrel. [...]
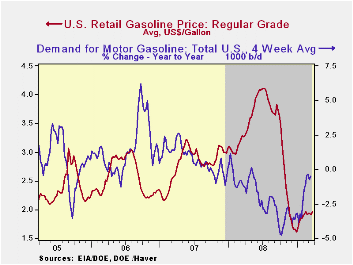
The potential for OPEC restraint in crude oil production recently helped to lift prices for crude oil. For a barrel of West Texas Intermediate prices rose last week to $49.46, up roughly 50% from the December low of $32.37 per barrel. In futures trading yesterday, the May contract price for crude oil rose even further to $53.80 per barrel which was highest level since late November. Prices reached a high of $145.66 last July.
Regular gasoline prices the have followed the rise in crude despite the deepening worldwide recession. The price for regular gasoline rose last week to $1.96 per gallon. That also matched its highest level since last November. The latest was up 35 cents from the December low. Yesterday, the spot market price for regular gasoline also showed strength with a rise to $1.41 per gallon, up from $1.30 averaged last week and $1.20 during the week prior. These prices compare to those that were slightly below $1.00 at the end of last year. The figures are reported by the U.S. Department of Energy.
Weekly gasoline prices can be found in Haver's WEEKLY
database. Daily prices are in the DAILY
database.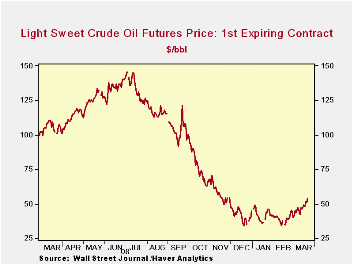
Gasoline demand continued to suffer due to the effects of the U.S. recession although earlier declines in gasoline prices have given some lift to driving. The latest y/y change of -0.5% moderated from the 4.8% rate of decline seen last October. (Gasoline prices at the time were just off their peak.) The change in demand is measured using the latest four weeks versus the same four weeks in 2008. Demand for all petroleum products was down 3.2% y/y. That negative comparison was led by a 9.9% decline in distillate demand and a 17.6% drop in residual fuel oil consumption. These numbers are available in Haver's OILWKLY database.
The price of natural gas continued downward with the coming end to the winter heating season. The decline to $3.83 per mmbtu (-58.0% y/y) was to the lowest level since 2002. The latest average price was down more than two-thirds from the high reached in early-July of $13.19/mmbtu.
American International Group is this morning's House testimony by Fed Chairman Ben S. Bernanke and it is available here.
The Role of the Federal Reserve in Preserving Financial and Monetary Stability Joint Statement by the Department of the Treasury and the Federal Reserve can be found here.
| Weekly Prices | 03/23/09 | 03/16/09 | Y/Y | 2008 | 2007 | 2006 |
|---|---|---|---|---|---|---|
| Retail Regular Gasoline ($ per Gallon, Regular) | 1.96 | 1.91 | -39.8% | 3.25 | 2.80 | 2.57 |
| Light Sweet Crude Oil, WTI ($ per bbl.) | 49.46 | 45.68 | -53.3% | 100.16 | 72.25 | 66.12 |
by Tom Moeller March 24, 2009
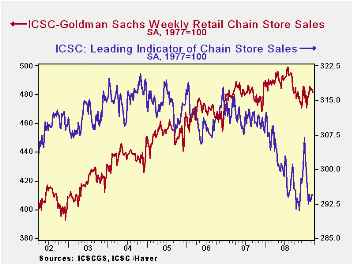
February chain store sales may belatedly have benefited as Christmas gift cards were cashed in. Now, however the effects of higher unemployment seem to have taken hold. Store sales fell in three of the last four weeks and the decline left the March level roughly even with the February average level. The International Council of Shopping Centers-Goldman Sachs Index indicated that the weekly declines during three of the last four weeks ranged from -0.1% and -0.6%.
The ICSC-Goldman Sachs retail chain-store sales index is constructed using the same-store sales (stores open for one year) reported by 78 stores of seven retailers: Dayton Hudson, Federated, Kmart, May, J.C. Penney, Sears and Wal-Mart.
During the last ten years there has been a 64% correlation between the year-to-year growth in chain store sales and the growth in general merchandise sales. These weekly figures are available in Haver's SURVEYW database.
The outlook for sales, moreover, remains cautious. Though the weekly leading indicator of chain store sales from ICSC-Goldman Sachs rose 0.1% last week (-4.3% y/y) after the prior week's 0.3% gain, those increases made up little of February's 2.3% flop.
The latest Business Outlook Survey from the Federal Reserve Bank of Philadelphia can be found here.
| ICSC-UBS (SA, 1977=100) | 03/21/09 | 03/14/09 | Y/Y | 2008 | 2007 | 2006 |
|---|---|---|---|---|---|---|
| Total Weekly Chain Store Sales | 481.3 | 483.4 | -1.4% | 1.4% | 2.8% | 3.3% |
by Louise Curley March 24, 2009
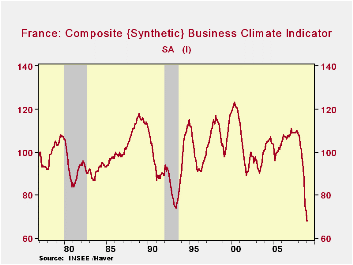
Confidence among French manufacturers in March remained at the all time low of 68 recorded in February, as can be seen in the first chart that shows the historical record of the series.
(INSEE, the National Institute of Statistics and Economics of
France, computes a synthetic indexes to measure confidence in overall
business, based on composite synthetic indexes for industry,
construction. services and retail and wholesale trade. The indexes are
so constructed that they have an average of 100 and a standard
deviation of 10. They are based on the replies of the respondents to a
survey regarding their recent output, orders, inventories and opinions
about the future of production and prices for their own business and
business in general. These replies are recorded in percent balances,
the difference between the percent expecting increases and the percent
expecting decreases.)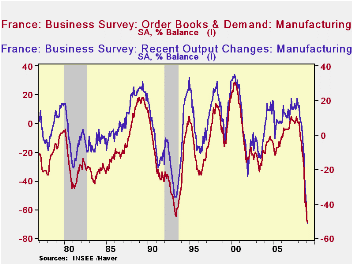
Given that the index was unchanged from February to March,
there were only very small, offsetting changes in the percent balances
of the items that make up the index, as can be seen in the table below.
The largest change was the 6 point improvement in the outlook for
production in general business, from -76% to -70%. The respondents were
also more positive on production in their own business and reported a
one point decline in inventories, which in view of the low demand, is a
positive. The rest of the components showed more negative balances. The
negative percent balance on recent changes in output, increased from
-49% in February to -51% in March, that for total order books went from
-67% to -69%, and for export order books, from -72% to -73%. To put the
current percent balances in perspective, the second chart shows the
historical record of the percent balances for two of the components of
the overall index--the recent changes in output and total order books
and demand.
| FRANCE | Mar 09 | Feb 09 | Mar 08 | M/M CHG | Y/Y CHG | 2008 | 2007 |
|---|---|---|---|---|---|---|---|
| Composite Business Climate Indicator (Synthetic) | 68 | 70 | 109 | -2 | -40 | 97 | 109 |
| Manufacturing Climate Indicator (Synthetic) | 68 | 68 | 108 | 0 | -40 | -97 | 111 |
| Recent Changes in Output (%) | -51 | -49 | 17 | -2 | -67 | 0 | 16 |
| Inventory Levels (%) | 23 | 24 | 11 | -1 | +12 | 18 | 00 |
| Total Order Books and Demand (%) | -69 | -67 | 1 | -2 | -70 | -19 | 2 |
| Export Order Books (%) | -73 | -72 | 1 | -1 | -74 | -17 | 6 |
| Personal Outlook on Production (%) | -45 | -46 | 15 | 1 | -60 | -4 | 15 |
| General Outlook on Production(%) | -70 | -76 | -5 | 6 | -76 | -31 | 8 |
| Personal Outlook on Prices (%) | -15 | -14 | 9 | -1 | -24 | 9 | 6 |
| General Outlook on Prices (%) | -35 | -33 | 49 | -2 | -84 | 30 | 27 |
by Robert Brusca March 24, 2009
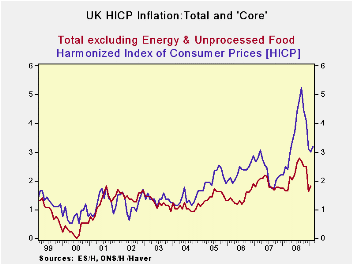
UK inflation spurted in February quite unexpectedly. As the
table shows, the month-to-month acceleration is quite widespread. UK
core inflation continues to hover below the key 2% level, although it
has ticked up this month too. Headline inflation has ticked higher and
now stands at 3.2% Yr/Yr. Three-and six-month headline inflation show a
sharp deceleration as you can tell from the included chart. UK
statistics have been a bit mercurial with surveys showing much more
weakness that the actual reports especially for things like retail
sales. It is certainly too soon to develop angst over inflation trends
in the UK. For the moment the month’s report is a curiosity. Surely
economic conditions are still too weak to engender any significant
inflation at this time. Still, Europe is the place that inflation is
most feared. The BOE has been bolder than the ECB and ECB policies
remain more restrictive than in the UK. Even so, having an inflation
scare in a country so close to home, even a scare of minor proportions,
is an issue. It is not the sort of thing that will get the kind of bold
action from the ECB that the European economies still seem to need. The
UK inflation blip is not good news.
| UK HICP and RPI Inflation | |||||||
|---|---|---|---|---|---|---|---|
| % MO/MO | % saar | ||||||
| Feb-09 | Jan-09 | Dec-08 | 3-MO | 6-MO | 12-MO | Yr Ago | |
| HICP | 0.7% | -0.1% | -0.5% | 0.4% | 0.7% | 3.2% | 2.5% |
| All Item RPI | 0.3% | -0.7% | -1.5% | -7.4% | -4.7% | 0.0% | 4.1% |
| RPI x | 0.7% | -0.1% | -0.6% | 0.0% | -0.3% | 2.6% | 3.6% |
| RPI excl Seasonal Food | 0.3% | -0.7% | -1.5% | -7.7% | -4.9% | -0.3% | 4.1% |
| Food & Beverages | 1.6% | 0.1% | 0.5% | 9.1% | 6.1% | 11.3% | 6.1% |
| Housing and HH Expenditures | -0.5% | -0.9% | -3.2% | -17.1% | -8.5% | -2.7% | 5.1% |
| Clothing & Footwear | 0.8% | -0.1% | -3.2% | -9.6% | -8.2% | -6.4% | -1.5% |
| Leisure Services | 0.4% | 0.4% | 0.2% | 4.2% | 4.7% | 5.3% | 3.1% |
| Leisure Goods | 1.5% | -0.1% | -1.9% | -1.9% | -3.6% | -3.6% | -2.7% |
| Motoring Expenditures | 1.9% | -1.9% | -2.3% | -9.1% | -16.7% | -7.4% | 5.2% |
| Fares and Travel Costs | -1.5% | -3.2% | 4.8% | -0.4% | 2.8% | 8.3% | 3.8% |
| A RED highlight indicates inflation accelerating from pace of previous horizon | |||||||
by Robert Brusca March 24, 2009
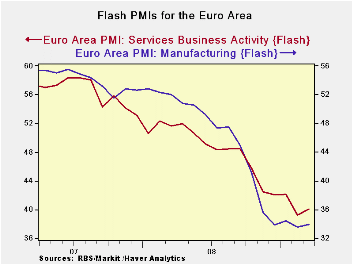
The manufacturing and Services indices from Markit show that
Euro Area PMIs have risen form the bottoms in this cycle. The moves are
small and the included chart demonstrates that the move is without much
vigor. The services sector is showing the most substantial rebound.
Still the services index remains in the lower 3.5% of its
range and the MFG index is in the bottom of 1.6% of its range both
since August 1998.
These reports are the first for March and they are the first
signs that the pace of decline in the European economy may be slowing.
They are still very weak signals since each resides well below the
neutral level for this survey which is at a value of 50. Neither survey
has developed any sort of upward momentum. So far all we have is a sign
of a lesser pace of decline, not of any actual improvement. But this is
how the end of the severe phase of recession looks. And it will be good
to get that behind us. Once this phase ends remedial actions have more
potential to help the economy. .
| FLASH Readings | ||
|---|---|---|
| Markit PMIs for the Euro Area | ||
| MFG | Services | |
| Mar-09 | 33.97 | 40.06 |
| Feb-09 | 33.55 | 39.24 |
| Jan-09 | 34.42 | 42.16 |
| Dec-08 | 33.87 | 42.06 |
| Averages | ||
| 3-Mo | 33.95 | 40.49 |
| 6-Mo | 37.25 | 41.96 |
| 12-Mo | 43.41 | 45.72 |
| 127-Mo Range | ||
| High | 60.47 | 62.36 |
| Low | 33.55 | 39.24 |
| % Range | 1.6% | 3.5% |

Tom Moeller
AuthorMore in Author Profile »Prior to joining Haver Analytics in 2000, Mr. Moeller worked as the Economist at Chancellor Capital Management from 1985 to 1999. There, he developed comprehensive economic forecasts and interpreted economic data for equity and fixed income portfolio managers. Also at Chancellor, Mr. Moeller worked as an equity analyst and was responsible for researching and rating companies in the economically sensitive automobile and housing industries for investment in Chancellor’s equity portfolio. Prior to joining Chancellor, Mr. Moeller was an Economist at Citibank from 1979 to 1984. He also analyzed pricing behavior in the metals industry for the Council on Wage and Price Stability in Washington, D.C. In 1999, Mr. Moeller received the award for most accurate forecast from the Forecasters' Club of New York. From 1990 to 1992 he was President of the New York Association for Business Economists. Mr. Moeller earned an M.B.A. in Finance from Fordham University, where he graduated in 1987. He holds a Bachelor of Arts in Economics from George Washington University.
More Economy in Brief


