 Global| Jun 29 2007
PCE Report is Weaker Than Expected With Good Inflation
Summary
Personal income +0.4% in May. Real PCE spending is up by just 01% in May as services spending falls by 0.1%. Core PCE +0.1% and +1.9% Yr/Yr. Consumption has a moderate contribution to growth in Q2 advancing by just 1.6% in the quarter [...]
Personal income +0.4% in May.
Real PCE spending is up by just 01% in May as services spending falls by 0.1%.
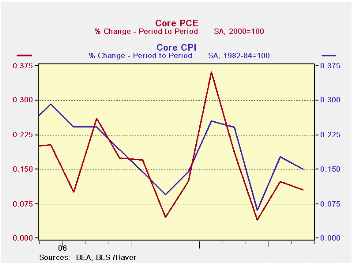
Core PCE +0.1% and +1.9% Yr/Yr.
Consumption has a moderate contribution to growth in Q2 advancing by just 1.6% in the quarter after its weak performance in May (see far right-hand column in table). The 0.5% gain in the overall PCE hit spending hard, reducing it.
Real disposable personal income is falling in Q2 down by 1.5%.
Core inflation continues lower… much like with CPI.
Inflation took a large bite out of nominal spending trends this month. Previously Q2 spending was on a much stronger track. On top of that, current dollar spending was weaker than expected, posting at a gain of 0.5%. That was made worse when translated into real terms by the 0.5% hike in the overall PCE deflator. As a result real spending was left with a gain of just 0.1% reducing its growth in Q2 to just 1.6%. (SAAR). The jump in the deflator also cut real disposable personal income down and it is now falling in the quarter as well as falling by 0.1% in the month. The saving rate continues negative and shows no sign of rising.
Perhaps the most surprising development in the report is the drop in services spending. While it spurted in April it had also fallen sharply in May. Services spending has now dropped in two of the past three months and is growing at just an annual rate of 0.7% over those three months. This is very weak for a sector that supplies the bulk of our employment. This weakness is the most troubling thing in this report.
The core deflator is, however, well behaved and the Fed will be happy with its trend. At 2.9% it is now inside the Fed’s comfort zone and the CPI is well inside of its zone as well.
| Percentage Changes At Annualized Rates: Various Horizons | |||||
| Inflation-adjusted | 1-Mo:AR | 3-Mos | 6-Mos | One Year | Q2/Q1 |
| Consumption | 0.8% | 0.9% | 2.8% | 3.1% | 1.6% |
| Goods | 3.7% | 1.3% | 3.0% | 3.7% | 0.3% |
| Durable Goods | 7.0% | 3.5% | 5.3% | 5.9% | 1.5% |
| Nondurable Goods | 2.0% | 0.2% | 1.8% | 2.6% | -0.4% |
| Services | -1.0% | 0.7% | 2.9% | 2.8% | 2.6% |
| Consumer Income | -- | -- | -- | -- | -- |
| Real DPI | -1.1% | -1.5% | 1.5% | 3.4% | -1.5% |
| Per Capita | -2.0% | -2.4% | 0.7% | 2.4% | |
| Memo: | May.07 | 3-Mos | 6-Mos | One-Year | -- |
| Savings Rate (Pct) | -1.4 | -1.0 | -1.0 | -1.1 | -- |
by Robert Brusca June 29, 2007
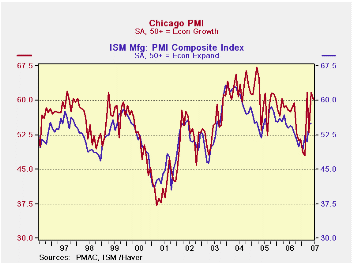
The Chicago PMI is a good guide to the ISM but not infallible; often its strength overshoots the ISM. Still any reasonable reading of the historic relationship leaves you positive on the outlook for the ISM in June.
The Chicago index keeps to stronger readings than the ISM in general. That explains why the strong Chicago readings are not so elevated when displayed as percentile standings within their historic ranges. The 60.2 headline reading stands in the top 25% of the measure’s range since 1996. It is 6% above its median reading. Indeed, if the ISM for this period is also some 6% above its median it will post a value of 56.3 this month, an increase of more than one point on the month.
Most Chicago survey components are in the upper 25 percent (or so) of their range of values since 1996. Deliveries are an exception as they have been for some time and as they are in many other regional MFG surveys. I take this as a sign that there is still a lot of slack in MFG; it’s a sign that orders can be filled quickly when they rise. Order back logs are only in the top third of their range and that component dropped three points this month in Chicago. Order backlogs and jobs are well correlated so it is not surprising to see the Chicago job component fell very sharply to 52.7 from 57.3, but it still stands well above its April reading of 50.5. Employment trends have become volatile but this month is the first pull-back in a job recovery in the Chicago region that dates back to a low reading in January of this year. The Cincinnati MFG report that was also released today shows an improvement from 27 previously to 30 in June.
On balance, the Chicago report is more upbeat than expected and it points to a strong ISM reading for June. It sides more with the strong reports we have seen in NY and Philadelphia and is NOT part of the weak reading reports such as we have seen in Dallas and Kansas City. The final column in the table below applies ISM-type weights to the Chicago components to recast the headline. On that basis the Chicago index is even stronger at least in its historic range. That tells us that the Chicago components are strong as a group although m/m they fell by a bit more that the ‘headline’ barometer.
| Since 1996 | Index | Orders | Production | Delivery | Inventories | Prices Paid | Employment | Backlogs | Weight |
| Date | 1994 To Date | ||||||||
| Jun.07 | 60.2 | 65.7 | 66.5 | 52.1 | 55.9 | 68.2 | 52.7 | 50.8 | 60.2 |
| May.07 | 61.7 | 71.1 | 69.8 | 45.3 | 52.6 | 70.2 | 57.3 | 53.0 | 62.4 |
| Apr.07 | 52.9 | 56.5 | 62.2 | 43.4 | 43.2 | 64.9 | 50.5 | 48.4 | 53.9 |
| Std Dev | 6.6 | 8.3 | 7.9 | 5.5 | 6.4 | 12.1 | 6.7 | 6.6 | 6.4 |
| Median | 56.6 | 59.6 | 60.8 | 51.7 | 48.4 | 61.2 | 50.6 | 49.4 | 56.3 |
| Mean | 55.0 | 57.9 | 59.1 | 52.2 | 48.3 | 61.6 | 48.6 | 48.7 | 54.4 |
| SD%MN | 12.0 | 14.3 | 13.4 | 10.5 | 13.3 | 19.7 | 13.7 | 13.6 | 11.8 |
| Max | 67.2 | 74.9 | 74.9 | 67.6 | 66.7 | 87.8 | 63.1 | 60.8 | 65.9 |
| Min | 37.2 | 36.5 | 37.8 | 41.0 | 33.3 | 34.8 | 23.6 | 30.2 | 36.6 |
| % MEDIAN | 106% | 110% | 109% | 101% | 116% | 111% | 104% | 103% | 107% |
| Percent-Range | 76.7% | 76.0% | 77.4% | 41.7% | 67.7% | 63.0% | 73.7% | 67.3% | 80.4% |
| %of2stdev | 69.7% | 73.5% | 73.3% | 49.4% | 79.5% | 63.6% | 65.3% | 58.0% | 72.3% |
| % Average | 109% | 113% | 113% | 100% | 116% | 111% | 108% | 104% | 111% |
by Robert Brusca June 29, 2007
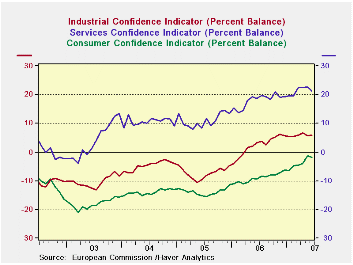
The EU sentiment reading is strong in June at 114.9 but off from 115.0 in May.
The accompanying charts plot the main component indicators for EU. Construction seems already to have hit a peak since it has been moving sideways for a number of months after peaking in September of 2006. Retail reached a reading of 5 in November 2006 and since has peaked at 6 in April. It is off in May and June. Clearly retailing is another sector that has lost the thrust of upward momentum. The services sector is a bit harder to read. It has backtracked in June but the series seems, other than that, to be in an uptrend but one that has lost a good degree of its up thrust. Consumer confidence spurted in May but has taken a strong setback in June. It’s too soon to read anything into that. The industrial sector is one clear bright spot for the EU region. It is moving up at what has been a slower but unrelenting pace since roughly April of 2006 after a period of much more rapid growth.
The table below provides some specifics on the indexes and their trends plus some country detail as to overall sentiment. First note that among the various EU indexes only the industrial sector is at its top reading. Retail is also strong in its 92nd percentile and construction, while flat for months, is in its 96th percentile. The consumer is lagging with an index that is only in its 86th percentile and services in the top 30 percentile of its somewhat shorter range. Clearly we are assessing different things here. The percentiles speak of the absolute strength of the sector relative to past readings. In the graphs we looked more at momentum, whether sectors are advancing or advancing as strongly as they had been. Both concepts are valid.
In the country section we look at the changes in recent sentiment readings m/m as well as the position of index levels relative to history. All key EMU countries have showed some waffling for their overall sentiment sometime within the past three months. But only the UK is on a two month back-to-back string of very strong increases. Italy has seen its sentiment fall for three months in a row. France, Germany and EMU are experiencing single month declines in overall sentiment. None of the key countries is experiencing super strong levels in sentiment since most are only in about the top 25 percentile of their respective country ranges. Spain is weaker as it is only in the top 40% of its range. Among the largest countries France is doing better, in the top 14 percentile of its range; Germany is in the top 23rd percentile. Overall the EU/EMU readings are stronger, in the 87th percentile, implying that the smaller countries of EMU must be doing relatively better.
There is evidence of a loss in momentum in EU/EMU. But the industrial sector is still very strong.
A similar table with values for the EMU industrial sector shows surprisingly that the relatively strongest component for industry across EMU is export orders – despite the relatively strong value for the euro. Order value is strong overall. But production expectations and selling price expectations are relatively weaker with prices only in the top third of their range and expected production in the top 18 percentile of its range. These are not weak showings, it’s just that they are showings that are weaker than other MFG components and they may be ‘telling us something’, especially as they are explicitly forward-looking.
As for countries, Germany and the UK (the later, an EU member not an EMU member) have the strongest industrial readings relative to their own history. France and Italy are lagging to some extent.
EMU industrial components by and large saw their momentum peak in June of 2006 (Yr/Yr gain) and have been losing momentum ever since. For example, industry confidence had gained 13 points Yr/Yr back in June of 2006; in June of 2007 its Yr/Yr gain is +3. The same is true for countries with the notable exception of non- EMU member UK whose 17 point gain Yr/Yr in June of 2007 for industrial confidence represents acceleration and it matches its current cycle peak of 17 made in February of this year.
| EU | Jun-07 | May-07 | Apr-07 | Mar-07 | Percentile | Rank | Max | Min | Range | Mean | w/Confid |
| Overall | 114.9 | 115 | 113.6 | 113.8 | 95.4 | 6 | 117 | 74 | 43 | 100 | 1.00 |
| Industrial | 7 | 6 | 6 | 6 | 100.0 | 1 | 7 | -27 | 34 | -7 | 0.89 |
| Consumer Confidence | -2 | -1 | -4 | -4 | 86.2 | 18 | 2 | -27 | 29 | -11 | 0.81 |
| Retail | 4 | 5 | 6 | 4 | 92.6 | 4 | 6 | -21 | 27 | -6 | 0.46 |
| Construction | 1 | 1 | 1 | 1 | 95.6 | 6 | 3 | -42 | 45 | -18 | 0.43 |
| Services | 21 | 23 | 22 | 22 | 71.1 | 55 | 32 | -6 | 38 | 17 | 0.80 |
| % m/m | Based on Level | Level | |||||||||
| EMU | -0.4% | 1.0% | -0.1% | 1.3% | 87.0 | 21 | 117 | 74 | 44 | 100 | 0.94 |
| Germany | -0.4% | 0.8% | 1.3% | 1.4% | 77.5 | 17 | 121 | 79 | 42 | 100 | 0.60 |
| France | -0.1% | 3.0% | 0.1% | 0.6% | 86.1 | 18 | 119 | 72 | 47 | 100 | 0.79 |
| Italy | -1.3% | -1.4% | -1.0% | 1.1% | 72.0 | 58 | 121 | 72 | 49 | 100 | 0.80 |
| Spain | 1.2% | -1.2% | -2.2% | 1.1% | 61.9 | 138 | 118 | 67 | 50 | 100 | 0.68 |
| Memo: UK | 1.6% | 3.4% | -0.8% | 1.5% | 93.7 | 5 | 119 | 69 | 50 | 100 | 0.36 |
| Since 1990 except Services (Oct 1996) 208 | -Count | Services: | 126 | -Count | |||||||
| Sentiment is an index, sector readings are net balance diffusion measures | |||||||||||
| EMU | Jun-07 | May-07 | Apr-07 | Mar-07 | Percentile | Rank | Max | Min | Range | Mean | w/Confid |
| Industry Confidence | 6 | 6 | 7 | 6 | 97.3 | 2 | 7 | -30 | 37 | -7 | 1.00 |
| Prod Expectations | 15 | 14 | 15 | 14 | 82.5 | 16 | 22 | -18 | 40 | 6 | 0.90 |
| Order Volume | 7 | 8 | 9 | 8 | 96.8 | 5 | 9 | -54 | 63 | -17 | 0.96 |
| Stocks (finished) | 4 | 5 | 4 | 4 | 9.5 | 186 | 23 | 2 | 21 | 10 | 0.91 |
| Export Order (Vol) | 5 | 6 | 5 | 5 | 98.2 | 2 | 6 | -51 | 57 | -19 | 0.90 |
| Selling Prod Expectations | 14 | 12 | 11 | 13 | 66.7 | 27 | 26 | -10 | 36 | 6 | 0.37 |
| Prod Trend (recent) | 13 | 13 | 14 | 12 | 93.5 | 7 | 15 | -16 | 31 | 1 | 0.92 |
| Employment Expect | 3 | 3 | 2 | 2 | 95.8 | 4 | 4 | -20 | 24 | -9 | 0.80 |
| Sentiment: | Level | Based on Level | Level | w/EMU | |||||||
| Germany | 9 | 9 | 9 | 9 | 95.7 | 6 | 11 | -35 | 46 | -10 | 0.79 |
| France | 2 | 0 | 2 | 2 | 76.8 | 40 | 15 | -41 | 56 | -8 | 0.82 |
| Italy | 5 | 6 | 8 | 5 | 77.1 | 34 | 13 | -22 | 35 | -3 | 0.78 |
| Spain | 0 | 0 | 2 | 3 | 86.3 | 44 | 7 | -44 | 51 | -8 | 0.65 |
| UK | 10 | 4 | 2 | 4 | 98.0 | 2 | 11 | -40 | 51 | -11 | 0.17 |
| Since 1990 | 208 | -Count | |||||||||
by Carol Stone June 29, 2007

New construction put-in-place surged by 0.9% in May, following 0.2% in April and 0.1% in March. This was the best performance since February 2006 and compared with Action Economics' forecast survey that called for just 0.1%. This month's report includes annual revisions of the construction data; besides the usual seasonal adjustment changes, a new sampling procedure is being used for public construction projects. Other alterations were made. As seen in the first graph, the net result is a downward shift in construction spending in the most recent months, with April lower by 2%, although the peak in early 2006 is now seen to be somewhat higher than before.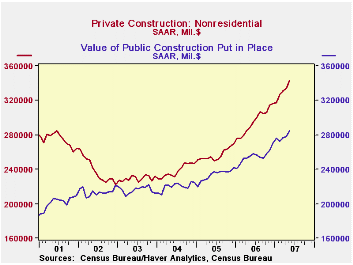
Residential building continued its contraction, although May's 0.8% decrease and April's -0.4% were not as bad as many recent months. This sector has declined continuously beginning in March 2006 and the monthly shrinkage has averaged 1.6%. So, indeed, April and May definitely look "less bad" with their smaller losses. Among types of residential construction, multi-family eked out a 0.3% increase in May and home improvements were flat after a 0.9% rise in April. These helped steady the sector even as single-family home construction weakened somewhat to a 1.4% decline after two smaller monthly reductions.
Private nonresidential and public construction both had impressive gains in May: 2.7% and 2.2%, respectively. And both have been strong for some time. Public construction has been up in 7 of the last 8 months, particularly at the state and local level. Private nonresidential has seen only 1 decrease since the middle of 2005. The wide range of building and structure types and uses probably helps this latter strength. Office building, for example, has slowed, but it is offset currently by advances in amusements and recreation. The biggest year-to-year growth is in hotel construction, up a whopping 65% over May 2006. There have been uptrends recently in communications and transportation. Health care and education spending, by contrast, are slowing.
These construction put-in-place data are in Haver's "flagship" USECON database. "Old" data, prior to the latest annual revisions, is in USARC07. The forecast of the monthly headline number comes from ASREP1NA, which includes Action Economics weekly forecast surveys and each indicator's initially reported figure for each period.
| Construction Put-in-Place | May 2007* | Apr 2007* | Mar 2007* | Year/ Year | 2006 | 2005 | 2004 |
|---|---|---|---|---|---|---|---|
| Total | 0.9 | 0.2 | 0.1 | -3.2 | 5.3 | 10.6 | 11.1 |
| Former | -- | 0.1 | 0.6 | -- | 4.7 | 10.5 | 11.6 |
| Private Residential | -0.8 | -0.4 | -1.3 | -17.7 | 0.0 | 13.5 | 18.7 |
| Private Nonresidential | 2.7 | 0.9 | 1.4 | 18.2 | 15.2 | 7.6 | 4.0 |
| Public | 2.2 | 0.6 | 1.6 | 12.8 | 9.0 | 6.3 | 1.9 |
by Robert Brusca New HICP is 1.9% Y/Y in June June 29, 2007
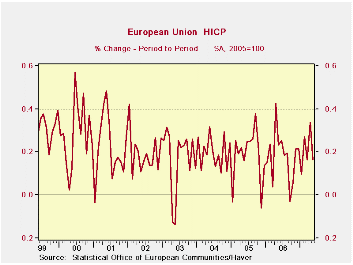
Despite the good HICP reading for EMU evidence for the month change shows some indicator of an escalation in inflation. The ECB is wary of inflation pressure. Money and credit growth - two indicators that the ECB watches - are showing signs of strength and excessive growth.
Six of 11 available EMU countries show readings on Yr/Yr CORE inflation that reveal a reading that is in excess of the 2% ceiling of the ECB. For the zone these trends are going to be weighted by each country’s importance, but the point is still valid. That is a lot of excess inflation in the zone and with the FLASH HICP just coming in a touch below the ceiling (at 1.9% compared to a ceiling of 2%). There is no room to breathe easy. Trends even suggest that there may be no room at all. Among these reports three show inflation accelerating in May compared to April (y/y) while only two show deceleration.
Three EMU countries show inflation well below the barrier as Finland and France sport Yr/Yr core HICPs of 1.4% and the Netherlands is at 1.6%. But Greece shows inflation of 3.0% Ireland has inflation of 2.8% and Luxembourg of 2.8%. In these comparisons it is the larger countries that are behaving and the smaller countries that are behaving worse. Still, the ECB has inflation on a razor’s edge just below its ceiling. There can be little comfort about this situation at the central bank.
| Core HICP | May-07 | Apr-07 | Mar-07 | Feb-07 | Jan-07 | Dec-06 | Nov-06 |
| Austria | 2.0% | 1.6% | 1.8% | 1.7% | 1.6% | 1.5% | 1.5% |
| Belgium | 1.9% | 2.0% | 2.0% | 1.7% | 1.6% | 1.6% | 1.5% |
| Finland | 1.4% | 1.4% | 1.4% | 1.3% | 1.2% | 1.0% | 1.0% |
| France | 1.4% | 1.4% | 1.3% | 1.4% | 1.4% | 1.5% | 1.4% |
| Germany | 2.1% | 1.9% | 1.7% | 1.8% | 1.7% | 1.0% | 1.1% |
| Greece | 3.0% | 3.1% | 3.5% | 4.0% | 3.6% | 3.4% | 3.3% |
| Ireland | 2.8% | 2.8% | 3.0% | 2.9% | 2.5% | 2.8% | 2.4% |
| Italy | 1.9% | 1.8% | 2.0% | 2.1% | 1.7% | 1.9% | 1.8% |
| Luxembourg | 2.8% | 2.7% | 2.4% | 2.4% | 2.4% | 2.3% | 2.2% |
| The Netherlands | 1.6% | 1.7% | 1.6% | 1.0% | 1.0% | 1.1% | 1.0% |
| Portugal | #N/A | 2.4% | 2.0% | 2.0% | 2.0% | 2.1% | 2.2% |
| Spain | 2.5% | 2.5% | 2.5% | 2.8% | 2.8% | 2.5% | 2.7% |
| Core HICP/CPI | |||||||
| UK (HICP) | 2.2% | 2.1% | 2.1% | 1.9% | 1.8% | 1.9% | 1.7% |
| US | 2.3% | 2.4% | 2.5% | 2.7% | 2.7% | 2.6% | 2.6% |
| Japan | -0.3% | -0.2% | -0.4% | -0.3% | -0.2% | -0.3% | -0.2% |
by Robert Brusca UK Consumer Confidence Drops to -3 in June from -2June 29, 2007
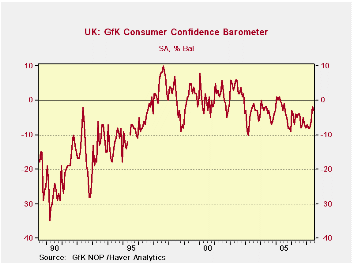
The UK measure of confidence has been stuck in range of zero to -8 since late 2005. Around March of this year it began to rise strongly. June is its first setback after two straight months of increase. While that does not seem like much the last time the UK index was as strong as -3 was June of 2006. It was last higher than -2 in July of 2005. So the index has come a long way in two short months.
Current conditions have improved only marginally with the household financial situation up to 25 in June compared to 23 in March when the index read -8. Major purchase plans are up to +6 from 2 in March. One big change is the assessment of the general economic situation. It stood at an index level of -33 in March but by June was at -24. The outlook readings continue to be more negative than the current situation or the view of the past. But since March these readings have improved considerably.
The economic situation ahead is assessed at -10, up strongly from -21 in March. Unemployment prospects are down to 29 from 32. The Household Financial situation is at 13 in June, up from 10 In March
Much of the improvement is on expectations. Current conditions have improved and a reassessment of the past has also improved the sense of the economy’s position.
On balance, the view of the past twelve months is very strong with savings and the household financial situation as a strong a set of responses as we ever see. The current financial situation is as good a response as we have seen as well, right at the top of its range. Current plans for major purchases are only about mid-range however – or weaker when compared to a longer history. As to the outlook The general and household situation plus prospects for savings score firm to strong readings with the household financial situation at the 85.7th percentile and the economic situation at the 76th percentile and savings in the 72nd percentile. Unemployment prospects are in the 44th percentile, indicating a mildly positive outlook, with fear of unemployment at less than average, but by a small margin. Major purchases ahead are in the bottom quarter of their range, however. As to income groups, upper and lower income groups have about the same assessment of circumstances and prospects.
| % of 2Yr | % of 10Yr | |||||
| Jun-07 | May-07 | Apr-07 | Mar-07 | Range | Range | |
| Consumer Confidence | -3 | -2 | -6 | -8 | 66.7% | 43.8% |
| Current | ||||||
| Household Financial Situation | 25 | 25 | 22 | 23 | 100.0% | 100.0% |
| Major Purchases | 6 | 4 | 6 | 2 | 47.6% | 34.5% |
| Last 12 Months | ||||||
| Household Financial Situation | 3 | 3 | 0 | 0 | 100.0% | 66.7% |
| General Economic Situation | -24 | -18 | -28 | -33 | 50.0% | 48.1% |
| CPI | 64 | 64 | 64 | 68 | 81.8% | 87.1% |
| Savings | 36 | 35 | 28 | 35 | 100.0% | 100.0% |
| Next 12-Months | ||||||
| Household Financial Situation | 13 | 13 | 11 | 10 | 85.7% | 75.0% |
| General Economic Situation | -10 | -10 | -18 | -21 | 76.5% | 80.0% |
| Unemployment | 29 | 28 | 30 | 32 | 44.4% | 58.3% |
| Major Purchases | -21 | -16 | -16 | -21 | 25.0% | 10.0% |
| Savings | 20 | 16 | 12 | 20 | 72.7% | 88.9% |
| By Income | ||||||
| Lower | -6 | -10 | -14 | -16 | 71.4% | 52.6% |
| Upper | 4 | 2 | 5 | 4 | 72.7% | 80.0% |
by Robert Brusca French Household Confidence Rises by Two PointsJune 29, 2007

French household confidence rises by two points.
Unexpected strength - critics say it can’t last.
Strongest reading since mid-2002.
Critics say that this spurt cannot last. A rise in confidence after the elections was expected. But this continuing rise is now on thin ice, or so many contend. A look at the survey responses may prove the critics correct, however. At best improved household confidence is speculative.
Much of the reason for the improved tone in the survey is based on the expectations of higher living standards over the next 12months. This response in the 80th percentile of its historic range is one of the stronger responses in the survey.
Consumers also expect to make more purchases. Car, home, and home renovation spending are high on consumers’ lists although NONE OF THESE improved in the current month. Oddly plans for consumer durable purchases are very weak, in the bottom 10% of their historic range. Expectations for unemployment in the next 12 months are in the bottom third of their range; the ability to save is in the 97th percentile for the next 120 months.
The current financial situation is only rated in its 38th percentile. For the past 12 months it is rated in its 65th percentile. For the next 12-months it is rated in its 81st percentile.
A lot is riding on the future, even the French admit; they ain’t seen nothin’ yet...it’s what they expect to see in the future that is driving confidence.
Sarkozy better be able to deliver the goods.
| Since Jan 1990 | Since Jan 1990 | |||||||||
| Jun-07 | May-07 | Apr-07 | Mar-07 | Percentile | Rank | Max | Min | Range | Mean | |
| Household Confidence | -12 | -14 | -20 | -22 | 61.4 | 38 | 5 | -39 | 44 | -21 |
| Living Standards | 10COLSPAN | |||||||||
| Past 12-Mos | -45 | -52 | -57 | -59 | 39.5 | 61 | 1 | -75 | 76 | -49 |
| Next 12-Mos | -4 | -2 | -17 | -20 | 80.4 | 19 | 7 | -49 | 56 | -25 |
| Unemployment: Next 12 m | -3 | -3 | 14 | 27 | 21.6 | 187 | 84 | -27 | 111 | 40 |
| Price Developments | 10COLSPAN | |||||||||
| Past 12-Mos | -10 | -6 | 1 | 4 | 61.4 | 64 | 29 | -72 | 101 | -32 |
| Next 12-Mos | -27 | -39 | -37 | -37 | 36.3 | 38 | 31 | -60 | 91 | -34 |
| Savings | 10COLSPAN | |||||||||
| Favorable to save | 35 | 31 | 26 | 27 | 49.2 | 152 | 66 | 5 | 61 | 43 |
| Ability to save Next 12-Mos | -3 | -2 | -10 | -11 | 97.2 | 3 | -2 | -38 | 36 | -20 |
| Spending | 10COLSPAN | |||||||||
| Favorable for major purchase | -6 | -10 | -10 | -12 | 64.4 | 43 | 15 | -44 | 59 | -14 |
| NSA | 10COLSPAN | |||||||||
| Car Purchase | -70 | -73 | -74 | -74 | 83.3 | 4 | -67 | -85 | 18 | -76 |
| Home Purchase Next 24-Mos | -82 | -85 | -86 | -86 | 90.9 | 2 | -81 | -92 | 11 | -87 |
| House renovation | -50 | -49 | -51 | -51 | 96.8 | 2 | -49 | -80 | 31 | -70 |
| Consumer durables | -10 | -10 | -9 | -9 | 14.6 | 186 | 2 | -12 | 14 | -2 |
| Financial Situation | 10COLSPAN | |||||||||
| Current | 13 | 17 | 12 | 11 | 38.1 | 99 | 26 | 5 | 21 | 14 |
| Past 12-Mos | -11 | -14 | -18 | -19 | 65.2 | 50 | -3 | -26 | 23 | -14 |
| Next 12-Mos | 4 | 6 | 0 | -1 | 81.5 | 21 | 9 | -18 | 27 | -2 |
| Number of observations in the period | 208 | |||||||||

Robert Brusca
AuthorMore in Author Profile »Robert A. Brusca is Chief Economist of Fact and Opinion Economics, a consulting firm he founded in Manhattan. He has been an economist on Wall Street for over 25 years. He has visited central banking and large institutional clients in over 30 countries in his career as an economist. Mr. Brusca was a Divisional Research Chief at the Federal Reserve Bank of NY (Chief of the International Financial markets Division), a Fed Watcher at Irving Trust and Chief Economist at Nikko Securities International. He is widely quoted and appears in various media. Mr. Brusca holds an MA and Ph.D. in economics from Michigan State University and a BA in Economics from the University of Michigan. His research pursues his strong interests in non aligned policy economics as well as international economics. FAO Economics’ research targets investors to assist them in making better investment decisions in stocks, bonds and in a variety of international assets. The company does not manage money and has no conflicts in giving economic advice.
More Economy in Brief


