 Global| Feb 11 2013
OECD Sees Mostly Slower Growth
Summary
In the OECD framework the US economy picked up a bit of steam in December. The UK and Japan each showed their ratios to trend above 100 and advanced slightly compared to November. But the sense of growth and momentum form the OECD [...]
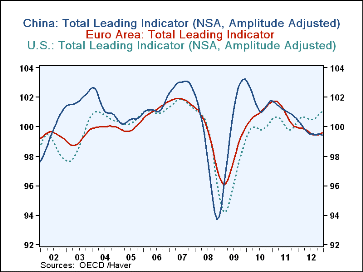 In the OECD framework the US economy picked up a bit of steam in December. The UK and Japan each showed their ratios to trend above 100 and advanced slightly compared to November.
But the sense of growth and momentum form the OECD leading indicators still is poor.
China continued to languish with a current reading below trend so its ratio-to-trend was below 100. It even weakened month-to-month. For all of EMU the ratio to trend reading stayed below 100 but it did improve slightly to 99.6 from 99.5. It is indicating continued weak growth.
Among a group including the original 11 countries in EMU (including Greece) only Ireland and Spain have (amplitude adjusted) ratios to trend that exceed 100. Spain's reading remains flat at a ratio of 101 in December while Ireland's ticked up to 101.4 from 101.3.
Despite the weak and languishing state of the EMU ratios-to-trend, only three of the eleven members in the table saw backtracking in December and one of those was Spain whose ratio is above 100. The other two are Belgium and France. No country faded by more than 0.1% on the month. The biggest month-to-month improvement came from Greece where its ratio index rose by 0.4% month-to-month followed by Portugal with a gain of 0.3% then by Finland and Germany each with gains of 0.2% Austria, Italy and Spain each rose by 0.1%, the average for EMU.
Ranking the EMU members by their ratio-to-trend standing compared to their respective queues since 1990 finds Ireland, Spain, Greece and Finland as the relative strongest- in that order. Also in order from the relative weakest to the stronger are Belgium, Italy, Austria and Germany.
Ireland is the relative strongest in EMU; it stands in the 82nd percentile of its historic queue measured back to 1990; while Finland, the weakest of the relative strong group sits at the 45th percentile, still below its midpoint. The weakest of the weak readings is from Belgium in the 18th percentile of its queue with Germany, the strongest of the weak cohort, only in the 21st percentile of tis queue. Only Three EMU members have ratios to trend values that place them above the midpoint of their distributions of observations (calculated from 1990 forward).
So once again we have a bevy of numbers that assess and position the countries of the Zone that shows some improvement yet also displays a strong degree of weakness. Since the OECD framework creates a bogey that increases in line with trend, the monthly indicator has to do better than trend to advance. Of the 15 countries in the table ten advanced two were flat and three backtracked this month. That's a pretty good ratio for improvement. But compared to history only five are better than their median ratio rankings from 1990 on. That says that despite some very minor improvement, conditions are still quite weak. In addition to the three EMU members that have done better than their respective medians, there is the US and the UK; Japan falls just short of this mark. And of the rankings the US is the relative best at the 89th percentile of its queue since 1990 on the OECD's ratio-to-trend measure.
In the case of the US a new recession usually does not start until the OECD indictor has gone 11 to 15 months from its mature-expansion period peak. In three cases involving the US recessions came on with shorter lags of six-months, eight-months and nine-months; the last recession in the US gave it a 9-month warning from its OECD peak.
The US is still advancing in this cycle according to its OECD metric. And while the economy has been churning out some odd, weak, signals, its OECD indicator says that more of the expansion phase lies ahead. This is despite a large sudden contraction in the US monthly trade deficit and a sharp pull-back in consumer attitudes. Europe is still in the very early dig-out phase.
| Ratios to Trend Amplitude Adjusted | ||||||||
|---|---|---|---|---|---|---|---|---|
| Monthly | 6-Mo Ago | 12-Mo Ago | Ratio to Months Ago | |||||
| Ratios to Trend | Dec-12 | Nov-12 | Oct-12 | Sep-12 | Jun-12 | Dec-11 | 6-Mo | 12-Mo |
| US | 101.0 | 100.9 | 100.8 | 100.6 | 100.5 | 100.2 | 100.5 | 100.8 |
| UK | 100.7 | 100.6 | 100.5 | 100.2 | 99.7 | 99.2 | 101.0 | 101.5 |
| Japan | 100.3 | 100.2 | 100.2 | 100.1 | 100.4 | 100.5 | 99.9 | 99.8 |
| China | 99.4 | 99.5 | 99.5 | 99.5 | 99.5 | 100.5 | 99.9 | 98.9 |
| Orig. EMU Members Ratio to Trend; Amplitude Adjusted | ||||||||
| Monthly | 6-Mo Ago | 12-Mo Ago | Ratio to Months Ago | |||||
| Ratios to Trend | Dec-12 | Nov-12 | Oct-12 | Sep-12 | Jun-12 | Dec-11 | 6-Mo | 12-Mo |
| EMU | 99.6 | 99.5 | 99.4 | 99.4 | 99.6 | 100.0 | 99.9 | 99.6 |
| Austria | 99.4 | 99.3 | 99.3 | 99.4 | 100.0 | 100.1 | 99.4 | 99.3 |
| Belgium | 99.2 | 99.3 | 99.4 | 99.5 | 99.8 | 99.8 | 99.5 | 99.4 |
| Denmark | 99.4 | 99.4 | 99.4 | 99.5 | 99.7 | 99.3 | 99.7 | 100.0 |
| Finland | 99.5 | 99.3 | 99.2 | 99.1 | 99.2 | 98.4 | 100.3 | 101.1 |
| France | 99.3 | 99.4 | 99.5 | 99.6 | 99.8 | 100.1 | 99.5 | 99.2 |
| Germany | 99.2 | 99.0 | 98.8 | 98.8 | 99.4 | 99.9 | 99.8 | 99.3 |
| Greece | 99.9 | 99.5 | 99.4 | 99.4 | 99.2 | 98.2 | 100.7 | 101.8 |
| Ireland | 101.4 | 101.3 | 101.1 | 101.0 | 100.7 | 99.9 | 100.7 | 101.5 |
| Italy | 99.3 | 99.1 | 99.0 | 99.0 | 99.0 | 100.1 | 100.2 | 99.1 |
| Spain | 101.0 | 101.0 | 100.9 | 100.9 | 100.8 | 100.6 | 100.2 | 100.4 |
| Portugal | 99.5 | 99.2 | 99.0 | 98.8 | 98.3 | 98.3 | 101.2 | 101.2 |
| Slowdown is indicated by BOLD RED | ||||||||
Robert Brusca
AuthorMore in Author Profile »Robert A. Brusca is Chief Economist of Fact and Opinion Economics, a consulting firm he founded in Manhattan. He has been an economist on Wall Street for over 25 years. He has visited central banking and large institutional clients in over 30 countries in his career as an economist. Mr. Brusca was a Divisional Research Chief at the Federal Reserve Bank of NY (Chief of the International Financial markets Division), a Fed Watcher at Irving Trust and Chief Economist at Nikko Securities International. He is widely quoted and appears in various media. Mr. Brusca holds an MA and Ph.D. in economics from Michigan State University and a BA in Economics from the University of Michigan. His research pursues his strong interests in non aligned policy economics as well as international economics. FAO Economics’ research targets investors to assist them in making better investment decisions in stocks, bonds and in a variety of international assets. The company does not manage money and has no conflicts in giving economic advice.


