 Global| Oct 08 2012
OECD's Composite Leading Indicators
Summary
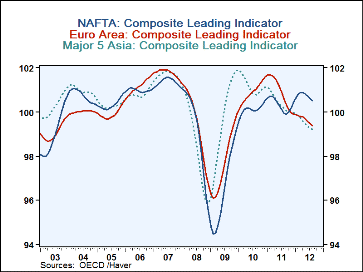
The OECD's August Composite Leading Indicators, (CLIs) published today and shown in the Haver data base, OECDMEI, are further evidence of the world wide slow down in economic activity. There were declines in the composite leading [...]
 The OECD's August Composite Leading Indicators, (CLIs) published
today and shown in the Haver data base, OECDMEI, are further evidence of
the world wide slow down in economic activity. There were declines
in the composite leading indicators for such broad areas as the Euro
Area, NAFTA and the Major 5 in Asia (China, India, Indonesia, Japan
and Korea) as shown in the first chart. In only three countries--the
United Kingdom and Brazil and China--did the composite leading indicator
increase in August and that in China by only 1 basis point that is hardly
significant.
The Composite Leading Indicators are amplitude adjusted, meaning that 100 represents the long term average and that data above 100 are above the long term trend and those below 100 are below the long term trend. Thus the CLIs allow one to distinguish between the increases and decreases that are above or below trend. An increase in the CLI above trend is indicative of real expansion while one below trend is more likely to be merely indicative of recovery. Although the CLIs for the China and Brazil increased in August, activity was still below trend. The CLI for the U.K. managed to rise slightly above the long term trend and that for Brazil is very close to its long term trend. Thus the increases in the CLIs for the U. K. and Brazil suggest growth in these countries could soon lead to expansion. A decline in a CLI above trend might be indicative of a temporary weakness while a decline in a CLI below trend is more likely to be indicative of a further contraction in activity. Declines in CLIs below trend are becoming more common. In August, the CLIs of France and Germany declined 0.10% and 0.25% respectively
| OECD COMPOSITE LEADING INDICATORS | ||||||||
|---|---|---|---|---|---|---|---|---|
| Aug'12 | Jul'12 | Aug'11 | M/M % | Y/Y % | 2011 | 2010 | 2009 | |
| Euro Area | 99.38 | 99.48 | 100.78 | -0.10 | -1.19 | 100.90 | 100.87 | 97.70 |
| Asia 5* | 99.21 | 99.27 | 100.14 | -0.06 | -0.93 | 100.40 | 101.18 | 99.54 |
| NAFTA | 100.57 | 100.60 | 99.94 | -0.08 | 0.59 | 100.33 | 101.12 | 96.55 |
| United Kingdom | 100.12 | 99.99 | 100.11 | 0.13 | 0.01 | 100.56 | 101.93 | 98.66 |
| Brazil | 99.45 | 99.21 | 98.87 | 0.19 | 0.59 | 99.58 | 101.17 | 98.28 |
| China | 99.40 | 99.39 | 100.64 | 0.01 | -1.23 | 100.85 | 101.67 | 99.98 |
| Germany | 98.89 | 99.14 | 100.75 | -0.25 | -1.84 | 101.35 | 101.93 | 96.84 |
| France | 99.47 | 99.51 | 100.56 | -0.10 | -1.09 | 100.70 | 100.10 | 98.21 |
More Economy in Brief
 Global| Feb 05 2026
Charts of the Week: Balanced Policy, Resilient Data and AI Narratives
by:Andrew Cates


