 Global| Aug 07 2009
OECD LEIs Turn On A Green Light For Recovery
Summary
The OECD LEIs are now jumpin.’ The rise is strongly accelerating across OECD countries; even Japan whose indicator is still falling is seeing a substantial shift in its negative growth rate to a substantially diminished pace of [...]
The OECD LEIs are now jumpin.’ The rise is strongly
accelerating across OECD countries; even Japan whose indicator is still
falling is seeing a substantial shift in its negative growth rate to a
substantially diminished pace of decline. The detailed progressive
growth rates from 12-months to six months to three months show that the
acceleration is well in force. The OECD’s preferred reading is on the
six month growth rate. The US rate is now flat compared to declining at
a 16% pace six months ago. The European index is up at a very strong
6.4% pace after dropping at a 12% rate six months ago. Japan is falling
at a 7% rate after dropping at a 22% rate six months ago. What a
difference a half year makes.
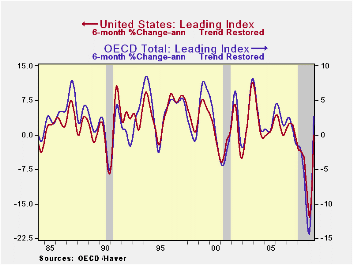
The United State’s own LEI from the Conference Board usually
carves out lower recession lows than the OECD LEI for the US. The
Conference Board indicator usually carves out higher highs in the
transition to recovery, by a small amount, as well. In this recession
however the OECD LEI for the US is much weaker than the low for the
Conference Board’s measure based on percentage drops in the respective
indices. As a result, while the OECD index has a bigger US turnaround
from its low to its present value, the positive reading on the
Conference Board LEI is far stronger that the current OECD LEI signal
(the OECD measure is flat over six months).
Different measures capture different aspects of the economy’s
weakness. Right now both of these measures have the same sort of
positive momentum to different degrees but positive momentum
nonetheless. It is interesting that the European economies are showing
much more momentum in this framework. We will have to keep our eye on
the economies and see if European economic performance can live up to
the strong positive signal the OECD has for that region.
| OECD Trend-restored leading Indicators | ||||||
|---|---|---|---|---|---|---|
| Growth progression-SAAR | ||||||
| 3Mos | 6Mos | 12mos | Yr-Ago | |||
| OECD | 11.0% | 2.7% | -6.1% | -2.9% | ||
| OECD7 | 10.4% | 1.3% | -7.6% | -3.3% | ||
| OECD.E-Area | 16.0% | 6.4% | -3.2% | -3.9% | ||
| OECD.Japan | -4.4% | -7.1% | -15.0% | -1.9% | ||
| OECD US | 11.4% | 0.0% | -8.5% | -3.2% | ||
| Six month readings at 6-Mo Intervals: | ||||||
| Recent six | 6Mo Ago | 12Mo Ago | 18MO Ago | |||
| OECD | 2.7% | -14.2% | -4.2% | -1.5% | ||
| OECD7 | 1.3% | -15.8% | -4.2% | -2.5% | ||
| OECD.Eur | 6.4% | -12.0% | -6.9% | -0.7% | ||
| OECD.Japan | -7.1% | -22.3% | 2.0% | -5.6% | ||
| OECD US | 0.0% | -16.3% | -4.3% | -2.2% | ||
| Slowdowns indicated by BOLD RED | ||||||

Robert Brusca
AuthorMore in Author Profile »Robert A. Brusca is Chief Economist of Fact and Opinion Economics, a consulting firm he founded in Manhattan. He has been an economist on Wall Street for over 25 years. He has visited central banking and large institutional clients in over 30 countries in his career as an economist. Mr. Brusca was a Divisional Research Chief at the Federal Reserve Bank of NY (Chief of the International Financial markets Division), a Fed Watcher at Irving Trust and Chief Economist at Nikko Securities International. He is widely quoted and appears in various media. Mr. Brusca holds an MA and Ph.D. in economics from Michigan State University and a BA in Economics from the University of Michigan. His research pursues his strong interests in non aligned policy economics as well as international economics. FAO Economics’ research targets investors to assist them in making better investment decisions in stocks, bonds and in a variety of international assets. The company does not manage money and has no conflicts in giving economic advice.
More Economy in Brief


