 Global| Sep 07 2007
OECD LEIs Show Upswing Has Topped Out…in July
Summary
The OECD leading indicator tells a solid story of business expansion past and future. The current reading is not quite what we would like, however. The rise in these indicators that came on a six month change basis - in March of [...]
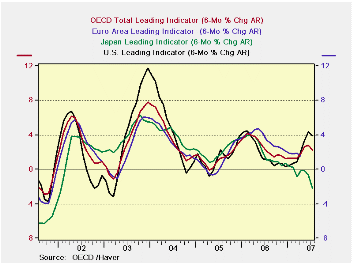
The OECD leading indicator tells a solid story of business expansion past and future. The current reading is not quite what we would like, however. The rise in these indicators that came – on a six month change basis - in March of this year have been swept away by events. The Euro area index never had much of a pop. On reflection, it seems to be in a longer term declining mode. But it did have a bit of an uptick earlier this year. Japan has simply been and continues to be sickly. These indicators, that are forward-looking, may contrast with some of the things you have heard about the strength of the global expansion recently, even from our own Treasury Secretary. One of the things he has said is that he can’t image a really weak US economy with such a strong global economy. Guess what? That global economy isn’t so strong any more.
The US as always has the greatest amplitude on this chart. It has had the strongest rebound and now is beginning to back off. These data do not even draw from the period when financial turmoil reared up.
| Jul-07 | Jun-07 | May-07 | 3-Mo | 6-Mo | 12-Mo | |
| OECD | -0.1% | 0.3% | 0.5% | 2.4% | 2.5% | 4.0% |
| OECD7 | -0.2% | 0.3% | 0.5% | 2.5% | 2.4% | 3.1% |
| OECD Europe | -0.2% | 0.1% | 0.2% | 0.5% | 0.7% | 2.1% |
| OECD Japan | -0.8% | -0.4% | 0.0% | -4.5% | -2.7% | -1.8% |
| OECD US | 0.0% | 0.7% | 0.7% | 5.8% | 4.9% | 5.8% |
by Robert Brusca September 7, 2007
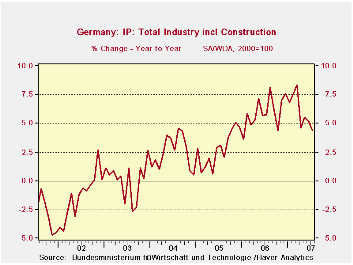
The ratchet lower in German production follows the sharp weakening in German industrial orders. The sequential growth rates in the table below do not show the slowing due to base effects (in April). The table shows that IP was soft in July and weak in June. But April was a very weak reading so that the May gain carries the three-month average to a decent three-month growth rate. Yes IP is clearly slowing, not accelerating, as the accompanying chart makes. The weakness is in consumer goods. Consumer good output is down in two consecutive months and in the quarter to date; it is off at an annual rate of 12.3%. But, capital goods output remains strong. It is up by 1.1% in July; a small drop in June was sandwiched between strong performance in May and July. In the quarter it is growing at an annual rate of 10.2%. Intermediate goods output seems to be slowing as well but is carrying momentum in the new quarter. Construction is choppy and is flat in the new quarter.
Still German IP is growing at a 4% Y/Y rate and that is not weak, just slower than it was. The six-month growth rate is weaker at 3.2%. The real question is that with the US slowing and the OECD leading indicators pointing to weaker growth will the strength in capital equipment remain in place? That seems unlikely. Germany keeps waiting for the consumer to join the party but that’s as long a wait as for President Bush to pull the troops out of Iraq. Even that one might come to fruition before the German consumer gets wild with the purse strings.
Europe does seem to have an authentic slowing in train. We can’t quite pinpoint how weak things will get. But, except for China, a global chill seems to have set in and surprisingly it seems to be registering before we have seen the impact from the financial turmoil that developed in August and whose larger impacts should not be seen until September or thereafter. That makes this slowing all the curious and problematic for policymakers. The OECD and IMF growth warnings now have more substance with a weakening US job growth trend already as a reality.
For Germany a further slowing lies ahead. Germany has prospered on the strength of foreign demand; now that a slowdown is in gear in the wake of its VAT tax hike the consumer will probably become even more cautious. Capital spending is pro-cyclical so it will slow, too.
Europe is no longer what it one was. Its day in the growth-sun was short-lived. And its rate of unemployment is still stubborn at a high level. Germany is a prime example of these trends.
| Saar except m/m | Jul-07 | Jun-07 | May-07 | 3-mo | 6-mo | 12-mo | Quarter-to-Date |
| IP total | 0.1% | -0.2% | 1.9% | 7.6% | 3.2% | 4.4% | 3.7% |
| Consumer | -0.8% | -2.7% | 1.3% | -8.6% | -2.1% | 0.6% | -12.3% |
| Capital | 1.1% | -0.2% | 2.1% | 12.4% | 5.2% | 7.7% | 10.2% |
| Intermediate | -0.2% | 0.6% | 2.1% | 10.4% | 3.7% | 6.4% | 5.5% |
| Memo | |||||||
| Construction | 1.3% | -2.0% | 0.2% | -2.0% | -18.5% | -4.5% | 0.0% |
by Carol Stone September 7, 2007
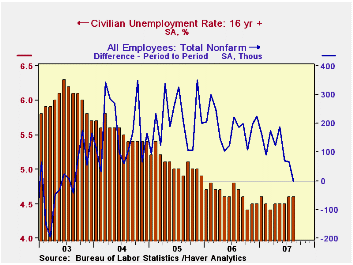
Oh, well. Nonfarm payrolls declined 4,000 in August, the first monthly decrease since August 2003. Needless to say, forecasters and market participants are surprised at this outcome; the consensus expected a pickup to a 113,000 gain following July's originally reported 92,000. Instead, July and June were both revised downward, as noted in the table below; the two-month reduction was 81,000.
The three-month change in payrolls thus slowed to just 44,0000 on average, also the weakest since the summer of 2003 and much less than the 109,000 average for this year to date.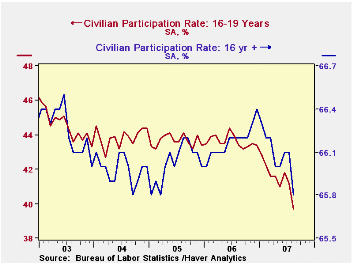
The unemployment rate held at 4.6% in August. Household employment fell 316,000 (-0.2% or +0.8% y/y) following a 30,000 cut during July. The labor force, though, declined more, by 340,000 (also 0.8% y/y) so despite the decline in this employment measure, the number unemployed also declined, by 24,000. The labor force participation rate dipped to 65.8%, the lowest since March 2005. BLS commentary points out that much of this decline occurred among teenagers, who accounted for almost three-quarters of the drop in the labor force, as they were apparently returning to school.
From the establishment survey, private service sector jobs posted a relatively modest 88,000 (1.9%) gain after a 130,000 July rise which was revised very slightly downward. So far this year, these industries have added an average of 124,000 per month; last year’s average monthly gain was 159,000. Retail employment improved, adding 13,000 jobs (+0.7% y/y) during August, lifting the average increase this year to almost 10,000 per month after an outright decline of 2,700 per month during 2006. In the financial sector, the number of jobs was unchanged from July, which was revised a bit lower to a 24,000 increase from 27,000 reported a month ago. The average gain this year has been 6,000 versus 16,000 last year. Professional & business services employment rose just 6,000 after July's 25,000 increase. The average gain this year has been 16,000 per month, off from last year's average of 42,000.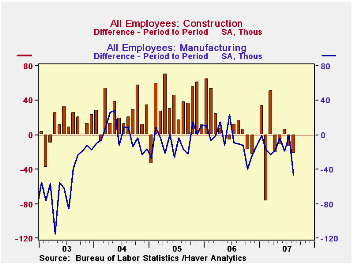
Factory sector payrolls fell 46,000 (-1.5 y/y) and jobs have fallen in every month beginning in July 2006. Construction employment declined again in August, by 22,000 after July's 14,000 decrease; the latest was more than accounted for among residential builders and specialty trades contractors. Construction jobs have fallen 7,000 per month this year versus an average 11,000 increase per month during 2006.
Government payrolls fell again by 28,000 (+0.6% y/y) in August, while July's original 28,000 decline was revised to 52,000. So far in 2007, this sector has added a mere 5,000 monthly, compared with the per month average last year of 20,000.
Average hourly earnings increased 0.3%, the same as in July. Factory sector earnings rose 0.1% (2.7% y/y) and private service producing earnings rose 0.3% (4.1% y/y). The monthly average increase in overall average hourly earnings this year has been 0.3% versus 0.4% per month last year.
| Employment : 000s | August | July | June | Y/Y | 2006 | 2005 | 2004 |
|---|---|---|---|---|---|---|---|
| Payroll Employment | -4 | 68 | 69 | 1.2% | 1.9% | 1.7% | 1.1% |
| Previous | -- | 92 | 126 | -- | -- | -- | -- |
| Manufacturing | -46 | -1 | -19 | -1.5% | -0.2% | -0.6% | -1.3% |
| Construction | -22 | -14 | 6 | -1.2 | 4.8% | 5.2% | 3.6% |
| Average Weekly Hours | 33.8 | 33.8 | 33.9 | 33.8 (Aug '06) | 33.8 | 33.8 | 33.7 |
| Average Hourly Earnings | 0.3% | 0.3% | 0.5% | 3.9% | 3.9% | 2.8% | 2.1% |
| Unemployment Rate | 4.6% | 4.6% | 4.5% | 4.7% (Aug '06) | 4.6% | 5.1% | 5.5% |

Robert Brusca
AuthorMore in Author Profile »Robert A. Brusca is Chief Economist of Fact and Opinion Economics, a consulting firm he founded in Manhattan. He has been an economist on Wall Street for over 25 years. He has visited central banking and large institutional clients in over 30 countries in his career as an economist. Mr. Brusca was a Divisional Research Chief at the Federal Reserve Bank of NY (Chief of the International Financial markets Division), a Fed Watcher at Irving Trust and Chief Economist at Nikko Securities International. He is widely quoted and appears in various media. Mr. Brusca holds an MA and Ph.D. in economics from Michigan State University and a BA in Economics from the University of Michigan. His research pursues his strong interests in non aligned policy economics as well as international economics. FAO Economics’ research targets investors to assist them in making better investment decisions in stocks, bonds and in a variety of international assets. The company does not manage money and has no conflicts in giving economic advice.
More Economy in Brief


