 Global| Dec 10 2018
OECD LEIs Point to Weakness
Summary
OECD LEIs point to weakness ahead for the OECD area as well as separately for the OECD seven largest economies, the euro area, and the United States. All LEI metrics declined in October as well as over three months, six months and 12 [...]
 OECD LEIs point to weakness ahead for the OECD area as well as separately for the OECD seven largest economies, the euro area, and the United States. All LEI metrics declined in October as well as over three months, six months and 12 months. Japan is the ‘exception’ in the table, with sequential declines but with flat performance in its LEI in the two most recent months.
The OECD prefers to look at its measure in terms of its six-month changes; that calculation is performed in the lower panel of Table 1. There we see familiar declines over six months joined by declines over the six months before that and then increases, but increases representing decelerations for the six months below that. The OECD metrics, with few exceptions, show this leading batch of countries/regions have a slowdown that has been baking in the oven for 18 months. Note that declines in the six-month averages over the recent six months as well as declines for the six months before that reinforce the powerful nature of these slowdown forces.
While the Fed in the U.S. would like to consider the U.S. an island and buffered from these effects overseas, the evidence does not support that. Fluctuating exchange rates do permit relatively more independent movement of national policies and more policy ‘insulation’ but it is clear that many of the same forces that are driving all these economies are forces that have been weakening. The OECD indicators signal slower than normal growth, but they do not give any clears reading on whether a recession is in prospect or not.
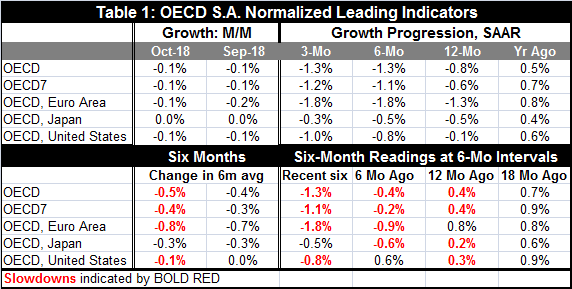
Table 2 shows that for the last four months nearly every reading for the OECD, the U.S., the U.K., the EMU, Japan, and China produces a value below 100, signaling below normal growth. Ratios to six months ago are below 100 across the board except for China and for six months before that all are below 100 except the U.S.
Within the EMU for the longest lived members, the LEI values are below 100 everywhere save in Austria over the last four months. However, six months ago, most EMU readings were still above 100 –only Ireland and Portugal were exceptions. Since then, the slowdown signal has broadened substantially. And 12 months ago, all the members in the table had above 100 readings. However, the metrics still have been broadly weakening. The ratio of the current value to six months and the six months ago reading to six months before that (the far right-most columns) show that out of 12 readings for each comparison (24 in all) only one has a value at 100 or above and this is for Austria that logs a value of 100- a neutral reading with regard to long-term growth prospects.
What we see for these metrics are absolutely low LEI readings and erosion in LEI values that both point to slowing conditions ahead. We find signals with relative deep roots. We find this at a time that central banks are dismantling stimulus programs or planning to do so. In the EMU, Germany is running fiscal surplus and Italy is being hounded to run a less stimulative policy by the EU itself. In the U.S., the Fed balance sheet has been in the process of shrinking as rate hikes also have been in train since end-2015. And despite ongoing financial distress and a sharply flattening yield curve, there is no consensus that the Fed will shelve its rate hike planned for December. But the Fed is expected to more broadly back off its rate hike path.
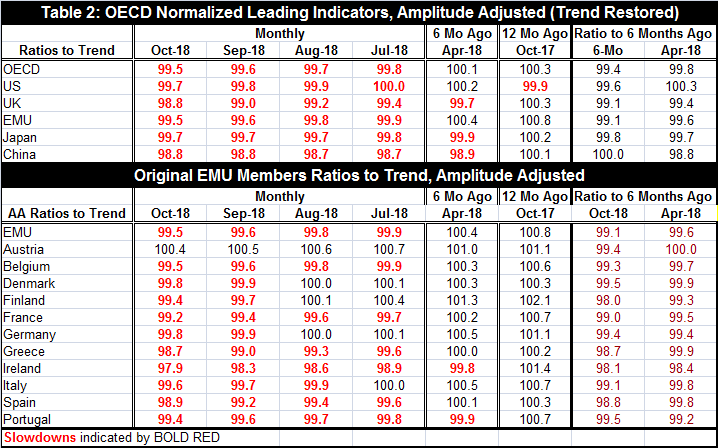
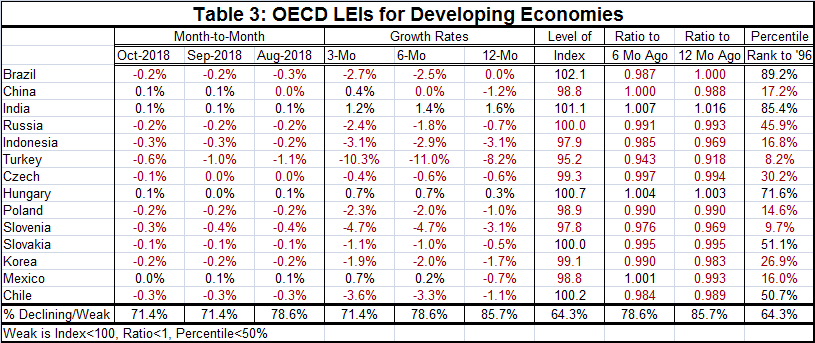
Table 3 concerns itself with developing economies. Here we find that the LEI indexes for Brazil (102.1), India (101.1) and Russia (100) all are at or above 100 signaling normal or above normal growth. China (98.8) has a reading below 100, but it has two consecutive monthly gains for its LEI and a net gain over three months to pair with flat performance over six months. The BRICS are doing better than other developing economics.
Sixty-four percent of the developing economics have LEI indexes at or below 100. Over each of the last three months, the LEIs have declined in over 70% of the countries in the table. The same is result holds for changes over three months, six months and 12 months; they are declining in more than 70% of the countries. And the same result obtains for the ratio of the current reading to six months ago and the ratio of six months ago to months before that. There is a broad legacy of slowdown in train and it is hard to gauge how deep it will become. But the breadth of it is worrying.
I also calculated rank standings of the index levels for developing countries. On that basis, only Brazil (89.2%), India (85.4%) and Hungry (71.6%) have historically strong or firm readings. Chile (50.7%) and Slovakia (51.1%) log indexes that barely surpass their respective medians (above 50%). China despite its recent momentum has a weak queue ranking. That standing is very low (in its bottom 17 percentile).
There is no way to sugar coat this news. It is not good and it likely stems from concerns over trade frictions explaining the global nature of the unraveling. Between global trade frictions and rising interest rates in the U.S. fading fiscal stimulus also in the U.S., there is a lot in the mix to explain financial markets concerns about growth. The U.S. interest sensitive sectors already have been hit despite slow interest rate increases made more modest by a voracious flattening of the yield curve. These are draining growth. Beware that the United States’ somewhat better recent U.S. economic performance is probably boosting the BRICS performance through their trade with the U.S. As U.S. growth suffers, the resilience of the BRICS that depend on the U.S. will be eroded as well.

Robert Brusca
AuthorMore in Author Profile »Robert A. Brusca is Chief Economist of Fact and Opinion Economics, a consulting firm he founded in Manhattan. He has been an economist on Wall Street for over 25 years. He has visited central banking and large institutional clients in over 30 countries in his career as an economist. Mr. Brusca was a Divisional Research Chief at the Federal Reserve Bank of NY (Chief of the International Financial markets Division), a Fed Watcher at Irving Trust and Chief Economist at Nikko Securities International. He is widely quoted and appears in various media. Mr. Brusca holds an MA and Ph.D. in economics from Michigan State University and a BA in Economics from the University of Michigan. His research pursues his strong interests in non aligned policy economics as well as international economics. FAO Economics’ research targets investors to assist them in making better investment decisions in stocks, bonds and in a variety of international assets. The company does not manage money and has no conflicts in giving economic advice.
More Economy in Brief


