 Global| Aug 08 2019
OECD LEIs Continue to Decay
Summary
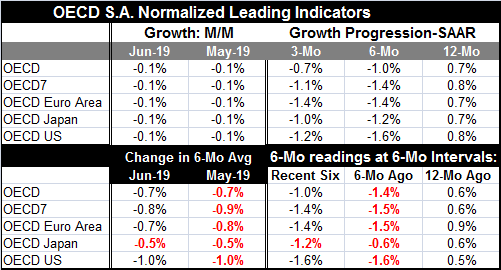
All of the OECD groups show declines in June and for the six months ended in June…all show declines for the previous six months as well. It is a well-flagged entrenched slowdown. For data by country, all ten in the table show LEI [...]
 All of the OECD groups show declines in June and for the six months ended in June…all show declines for the previous six months as well. It is a well-flagged entrenched slowdown.
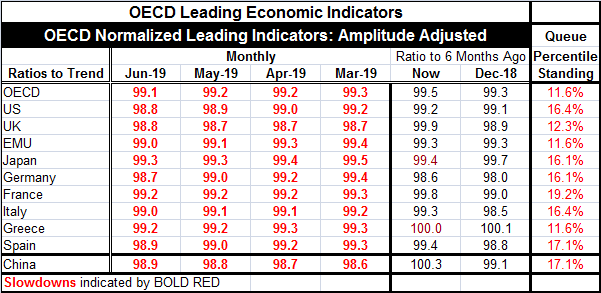
For data by country, all ten in the table show LEI values below 100 (100 signals ‘normal’ growth). Eight (Greece and China are exceptions) show current values weaker than six months ago. All (except Greece) also were weaker six months ago than over the six months before that.
In addition to the clear falling of the levels of the OECD LEI values and the changes over six-month segments (the OECD’s preferred horizon for viewing these data), we create rankings on the OECD LEI values that illustrate how weak the current values are in absolute terms compared to each country’s historic record. Every country in the table is in the bottom 20th percentile of its historic range of values ranked on data back to the early 1990s. The OECD aggregate is in its lower 11th percentile, a strikingly weak reading. And Greece, while its ‘series as stronger’ in some of the change categories, does so only because it had been so extremely weak previously when clamped under the unrelenting yoke of EU imposed austerity.
OECD LEI data point to ongoing weakening of a relatively severe and worsening nature. The OECD’s own interpretation is that the overall indicators point to relatively stable growth with weak growth signaled in the U.S., Germany and the EMU. I find this interpretation overly optimistic.
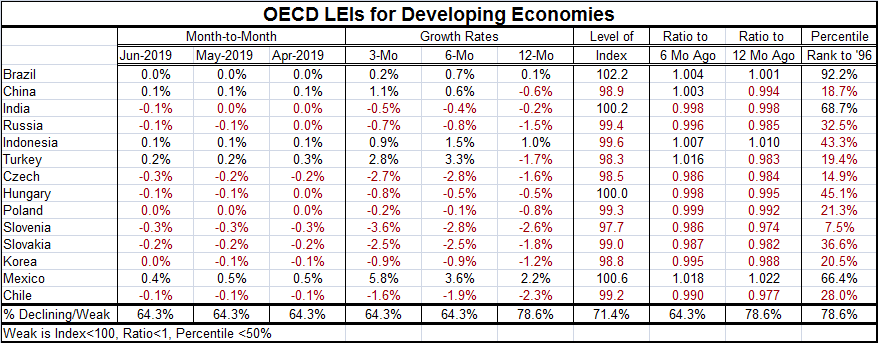
For a broad group of developing countries, there is clear evidence of LEI weakness. For three-month running (at least), about 2/3rds of the countries in the table show month-to-month declines. Over three months and six months, two thirds also show net declines. Over 12 months, over 3/4ths show declines. The simple level view of the OECD indicators shows that 78% are below the theoretically neutral reading of 100 that signals ‘average’ growth. Two thirds of the indicators show net lower readings over six months. 78% of all readings have weakening values over 12 months. And of the 14 countries in the table, only three have rank standings above a ranking of 50% which represents the historic average for each LEI series.
On balance, the OECD readings are not very reassuring. There are few LEI readings at or above 100 which is a level indicating normal or above normal growth. Nearly all observations indicate some sort of below average growth; in some cases that reading is close enough to ‘normal’ to call it ‘stable’ but the fact of the erosion and ongoing loss of momentum make that designation a bit too generous for me. I find the OECD LEIs a worrisome lot.

Robert Brusca
AuthorMore in Author Profile »Robert A. Brusca is Chief Economist of Fact and Opinion Economics, a consulting firm he founded in Manhattan. He has been an economist on Wall Street for over 25 years. He has visited central banking and large institutional clients in over 30 countries in his career as an economist. Mr. Brusca was a Divisional Research Chief at the Federal Reserve Bank of NY (Chief of the International Financial markets Division), a Fed Watcher at Irving Trust and Chief Economist at Nikko Securities International. He is widely quoted and appears in various media. Mr. Brusca holds an MA and Ph.D. in economics from Michigan State University and a BA in Economics from the University of Michigan. His research pursues his strong interests in non aligned policy economics as well as international economics. FAO Economics’ research targets investors to assist them in making better investment decisions in stocks, bonds and in a variety of international assets. The company does not manage money and has no conflicts in giving economic advice.
More Economy in Brief


