 Global| Jul 09 2018
OECD LEIs Are Positive But Have Stopped Rising
Summary
The OECD’s LEI markers are on a razor’s edge path. Few of the major country or regional indexes are truly either weak or strong. The indicators cluster on the line of neutrality, failing to give us the comfort we seek in these [...]
 The OECD’s LEI markers are on a razor’s edge path. Few of the major country or regional indexes are truly either weak or strong. The indicators cluster on the line of neutrality, failing to give us the comfort we seek in these uncertain times. And since the LEI data lag by two months, they do not give us the freshest signals at a time that we know there is disruption and fear of more disruption afoot.
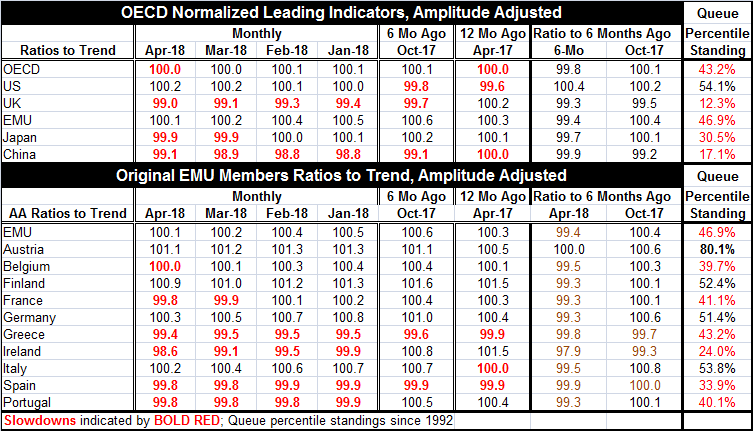
The OECD’s normalized (amplitude adjusted) indexes give off a positive sign when they are better than 100. For the entire OECD, the LEI is at 100 for April and March, down from the marginally superior 100.1 in the two previous months. The United States stayed at 100.2 for the second month in April following 100.1 in February. The EMU at 100.1 has been slipping steadily. The United Kingdom, Japan and China have index readings below 100.
In the OECD framework, 100 represents trend growth. So values at 100 are a trend signal while values above it signal above-trend growth and values below it are for below-trend growth. Right now most signals are relatively ‘clustered around 100’ with small variations. In fact, back to January 1990 (340 observations), the clustering around 100 (specifically the squared deviations from 100) for a group of nine OECD members plus China has been tighter than it is now less than 4% of the time.
The OECD gauge itself shows that six months ago the reading was higher while 12 months ago it was exactly what it is today. Six months ago in October, only the U.K. and China were showing gauges that were lower on balance over the last six months. As of April, all regions/countries are lower over six months except the U.S. (see ratio to six months ago columns).
On a wholly different gauge, the OECD LEIs are all below their respective median standings since January 1994 except the US. The strength in the U.S. economy is unusual and it is not even much at all as strength goes; it has a 54th percentile rank standing among past values, only moderately above its median which occurs at a 50th percentile standing.
Within the EMU, conditions have changed a lot. As of April, only Austria among the early EMU members has a current LEI reading above its value of six months ago. Six months ago in October of last year, only two of these EMU members (Greece and Ireland) had readings that were lower on balance over the last six months. European momentum has undergone a real reversal. Only four of ten EMU members have OECD LEI readings above their respective medians and of those only Austria has a reading that is anything like ‘strong’ (80th percentile standing). The other above-median readings are Italy (53.8%), Finland (52.4%), and Germany (51.4%). The overall EMU value is only as strong as its 46.9 percentile. The EMU is not impressive and has nowhere near the moment it had late last year.
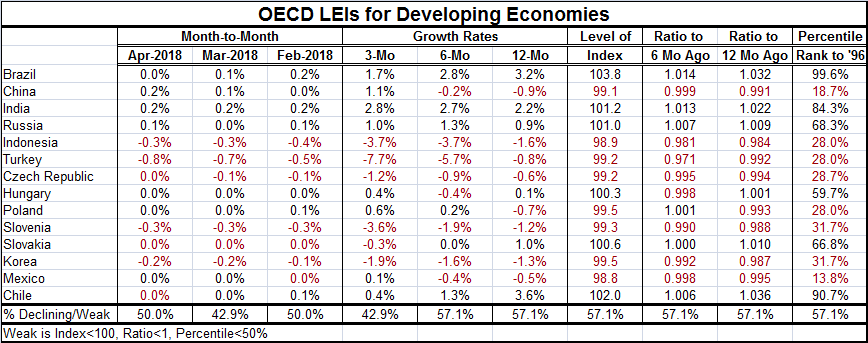
The OECD offers up a gauge for developing economics as well. A group of 14 is listed in the table below. The readings for these countries are clustered slightly to the weak side. Six of 14 of them have percentile standings above their respective medians back to January 1996. Three of them, Brazil, Chile and India, show standings in their respective 80th or 90th percentiles. However, another eight members in this group have readings in the bottom one third of their historic rank of values in percentile terms.
Over each of the last three months, the tendency of the readings to change is uneven and almost evenly divided between improving and worsening. Most show declines over six month and over 12 months. Most have levels below 100 and most have ratios below unity when comparing current values to values of six months ago; that is true also for the previous six months.
The evidence of weakness is convincing but not compelling. In most cases, the count is 8 to 6 usually favoring the signal for weakness. But 8 to 6 is too small a margin to be decisive even though holding for most measures and periods and only a plus-side signal for February in this table.
Brazil and Chile have strong index level readings and you see that in their percentile standings. India and Russia have firm-to-strong readings and you see that in their standings as well.
On balance, the OECD gauges are not very reassuring. They are certainly not alarming. But they do not paint a picture of elevated readings or of any pick-up in momentum. And while the U.S., U.K. and EMU all have monetary authorities that have expressed either desire for less accommodative policy or have actually shifted that way (as have the U.S. and U.K.), the global picture does not support it. Only the U.S. has a relatively firm-looking reading – not even a strong one. And now there is a trade war to throw into the mix.
These are among the reasons why I am less than supportive of the U.S. move to tighten policy so persistently. I realize that the U.S. decision will be made on U.S. data and on U.S. variables and the weight given to the rest of the world will be somewhere near zero with Donald Trump as President and with this new Fed and its new focus. There have been times when the Fed has had a more expansive and inclusive view of the policy landscape. International considerations have played a role in U.S. monetary policy in the past. In fact, as recently as in September 2015, the Fed postponed a rate hike to December because of international turmoil. I get the feeling that we have left such times behind us. Still, global and international events will intrude on U.S. circumstances. While many like to speak of tight global markets, the OECD data do not concur. Among the reasons that apparently tight U.S. labor markets fail to generate wage and price pressures is weak global demand and production opportunities outside the U.S. Trade wars will loosen those ties and could allow U.S. domestic inflation pressure to creep higher. That combined with more slack demand for U.S. exports could take the legs out from under U.S. growth causing weakness to undercut the economy and to undermine any price pressures that might develop. I really see little chance that trade wars will ramp up inflation.
I find this a risky time for the Fed to be pushing rates up aggressively specially in the absence of any real inflation. It remains something to watch. If the Fed keeps moving aggressively, that will put more pressure on the ECB. The ECB is now starting to focus on its successor to Mario Draghi. A much more rules oriented German head would seem to be the odds on favorite for the nest ECB head. If Europe has put its period of weakness behind it, that transition could work out well. If it has not, then there could be more trouble ahead for Europe.

Robert Brusca
AuthorMore in Author Profile »Robert A. Brusca is Chief Economist of Fact and Opinion Economics, a consulting firm he founded in Manhattan. He has been an economist on Wall Street for over 25 years. He has visited central banking and large institutional clients in over 30 countries in his career as an economist. Mr. Brusca was a Divisional Research Chief at the Federal Reserve Bank of NY (Chief of the International Financial markets Division), a Fed Watcher at Irving Trust and Chief Economist at Nikko Securities International. He is widely quoted and appears in various media. Mr. Brusca holds an MA and Ph.D. in economics from Michigan State University and a BA in Economics from the University of Michigan. His research pursues his strong interests in non aligned policy economics as well as international economics. FAO Economics’ research targets investors to assist them in making better investment decisions in stocks, bonds and in a variety of international assets. The company does not manage money and has no conflicts in giving economic advice.
More Economy in Brief


